
The short version: Conversion rate optimization (CRO) in a product-led growth company is not landing-page tinkering. It's the discipline of measuring and improving every step between "stranger sees your product" and "team pays you more this quarter than last." That spans marketing site, signup, activation, habit formation, monetization, and expansion — which is why PLG teams need a shared vocabulary that stretches across marketing, product, engineering, and data.
This glossary covers 60 terms we use every week inside client pods at Growaton, grouped by where they live in the funnel. Each definition includes what the term actually means in practice, and where teams typically get it wrong. Skim it, bookmark it, or steal it wholesale for your team wiki.
How to use this glossary
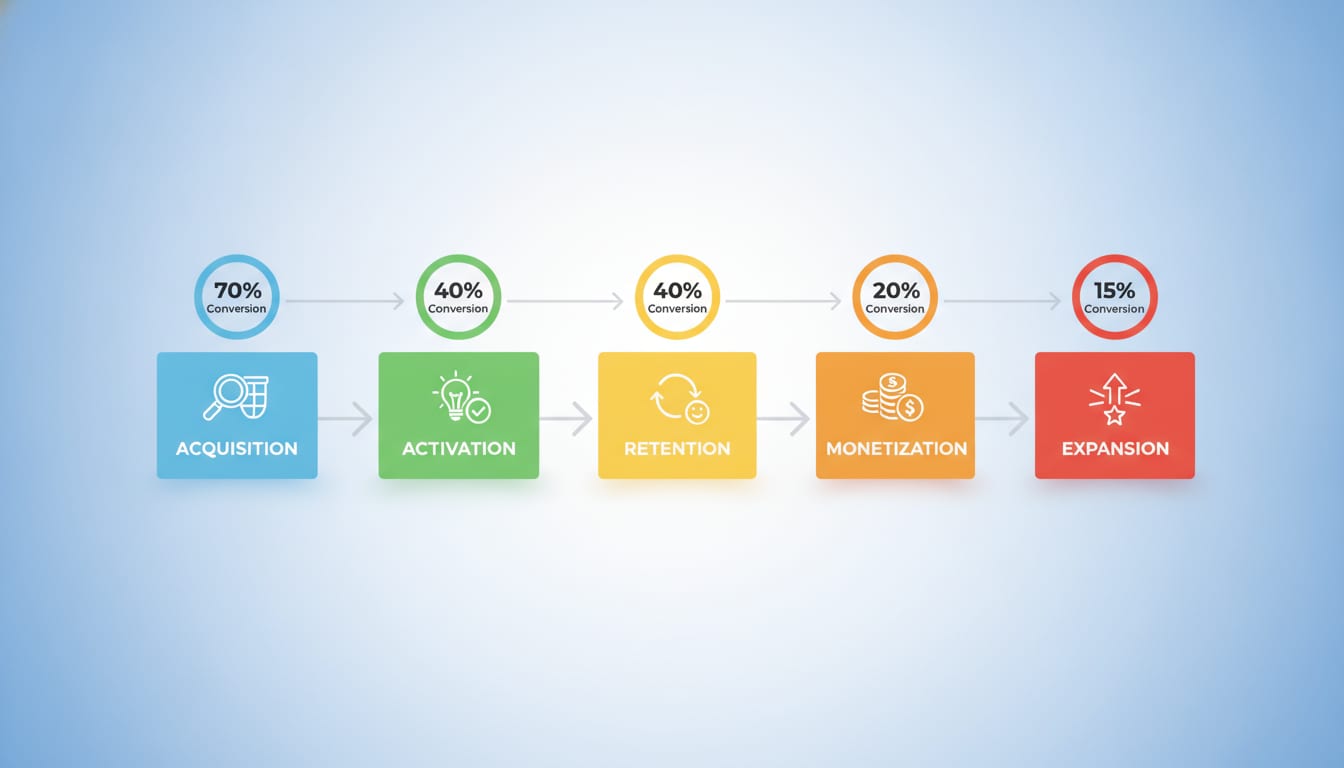
Terms are grouped into eight sections that mirror how a PLG funnel actually works:
| Section | Terms | Primary owner |
|---|---|---|
| Core conversion concepts | 1–8 | Growth lead |
| Experimentation & statistics | 9–20 | Growth engineering / data |
| Acquisition & traffic quality | 21–27 | Marketing |
| Signup & onboarding | 28–36 | Product |
| Activation & retention | 37–44 | Product / growth |
| Monetization & pricing | 45–51 | Founder / RevOps |
| Expansion & virality | 52–56 | Growth / CS |
| Measurement & tooling | 57–60 | Data / engineering |
One note before we start. The single most common failure we see isn't a lack of definitions — it's two teams using the same word to mean different things. "Activation" meaning "verified email" to marketing and "created three projects and invited a teammate" to product will quietly destroy a quarter of reporting. Write your definitions down. Put a number next to each one. Then argue about it once, in public, and move on.
Core conversion concepts
1. Conversion rate
The percentage of users who complete a defined action out of those who had the opportunity to complete it. Formula: conversions ÷ eligible population × 100. The word "eligible" is where most reporting breaks — if your denominator includes bots, internal traffic, or users on an entirely different pricing page, your number is fiction.
2. Conversion rate optimization (CRO)
The systematic practice of increasing the share of users who complete a target action, through research, hypothesis generation, experimentation, and shipping. In PLG, CRO applies to in-product steps as much as to marketing pages — an onboarding checklist redesign is CRO.
3. Micro conversion
A small, intermediate action that predicts a macro conversion: watching a demo video, connecting a data source, inviting a teammate. Useful because macro conversions are often too rare to test against directly. Track micro conversions as leading indicators, but never optimize one that doesn't correlate with revenue.
4. Macro conversion
The primary business outcome of a funnel: a paid subscription, a completed transaction, a booked call. Every experiment should ladder up to one, even when it's measured on a proxy.
5. Funnel
An ordered sequence of steps users pass through, with drop-off measured between each. PLG funnels are rarely linear — users loop back, invite others, and re-enter — but the funnel abstraction remains the fastest way to find where money is leaking.
6. Drop-off rate
The inverse of step conversion: the percentage of users who reach a step but don't complete it. Prioritize by absolute users lost, not percentage. A 5% improvement on a step 40,000 people hit beats a 40% improvement on a step 300 people hit.
7. Friction
Anything that increases the cognitive, physical, or temporal cost of progressing. Required fields, credit card walls, unclear copy, slow API responses. Not all friction is bad — friction that qualifies users (a "how many employees?" field that routes enterprise leads to sales) can raise revenue while lowering raw conversion rate.
8. Conversion lift
The relative improvement of a variant over control, expressed as a percentage of the baseline. A move from 4% to 5% is a 25% relative lift and a 1 percentage-point absolute lift. Always state which one you mean; conflating them is the most common way growth reports mislead a board.
Experimentation & statistics
9. A/B test
A randomized controlled experiment splitting traffic between a control and one variant, measuring the difference in a predefined metric. The randomization is the whole point — without it you're measuring seasonality and self-selection.
10. A/B/n test
The same design with multiple variants. Each additional arm splits your traffic further and increases the chance of a false positive, so budget your sample size before you add a fourth idea.
11. Multivariate test (MVT)
Tests multiple element combinations simultaneously to isolate individual and interaction effects. Powerful in theory, and almost always the wrong choice for a seed-to-Series C startup — you rarely have the traffic. Run sequential A/B tests instead.
12. Statistical significance
The probability that an observed difference isn't due to random chance, usually expressed as a p-value against a 0.05 threshold. Significance says nothing about magnitude or business relevance. A statistically significant 0.2% lift may not be worth the maintenance cost of the code.
13. Statistical power
The probability a test detects a real effect of a given size. The convention is 80%. Underpowered tests are the silent killer of experimentation programs: they produce "inconclusive" results, teams lose faith, and the program dies.
14. Minimum detectable effect (MDE)
The smallest lift your test can reliably detect given your baseline rate, sample size, and desired power. Calculate it before you build. If your MDE is 30% and your realistic ideas move things 5%, don't run the test — ship on judgment and measure directionally instead.
15. Sample size
The number of users (or sessions) needed per variant to reach your MDE at your chosen power and significance level. Evan Miller's sample size calculator remains the standard quick reference.
16. Peeking
Checking results before the predetermined sample size is reached and stopping when the numbers look good. It dramatically inflates false positive rates. If you need to monitor continuously, use sequential testing methods designed for it rather than fixed-horizon p-values.
17. Novelty effect
A short-term behavior change caused by the newness of a change rather than its inherent quality. Common in UI redesigns for existing users. Watch for lift that decays over the test window, and consider a holdout to measure the durable effect.
18. Sample ratio mismatch (SRM)
When the actual traffic split deviates significantly from the intended split (e.g., 52/48 on a 50/50 test). Almost always a bug in assignment, tracking, or redirect logic. Treat SRM as a hard stop: invalidate the test, fix the plumbing, rerun.
19. Guardrail metric
A metric you monitor to make sure a win in one place isn't causing damage elsewhere: refund rate, support tickets, page load time, churn, downstream activation. Every experiment we run at Growaton ships with at least two guardrails, because a signup-rate win that tanks activation is a loss.
20. Holdout group
A population deliberately excluded from a change (or from all changes) for a longer period, used to measure cumulative long-term impact. Especially valuable for lifecycle messaging and pricing changes, where short-window tests overstate benefit.
Acquisition & traffic quality
21. Landing page
A standalone page built for a single conversion goal, typically tied to a specific campaign or intent. The tell of a good one: you can state its single desired action in one sentence.
22. Message match
The degree to which the promise in an ad, email, or search snippet matches the headline and content of the destination. Poor message match is the cheapest, highest-impact CRO fix in most paid accounts.
23. Bounce rate
The share of sessions with no meaningful interaction. Note that Google Analytics 4 redefined this as the inverse of "engaged sessions" (sessions lasting 10+ seconds, or with a conversion or 2+ pageviews), which is not comparable to Universal Analytics bounce rate. See Google's engagement metric documentation before you compare to historical benchmarks.
24. Traffic quality
How well a traffic source's users match your ideal customer profile and their intent level. Two channels with identical click volumes can differ 10x in trial-to-paid rate. Optimizing CRO without segmenting by source leads you to optimize for your worst-fit visitors.
25. Product-qualified lead (PQL)
A user whose in-product behavior signals buying readiness — hit a usage limit, invited three teammates, connected a production data source. PQLs are the PLG replacement for the MQL, and defining yours precisely is usually worth more than any landing page test.
26. Marketing-qualified lead (MQL)
A lead judged ready for sales follow-up based on demographic fit and marketing engagement (content downloads, webinar attendance). In PLG motions, MQLs are a weaker signal than PQLs but still useful for enterprise-tier pipeline.
27. Self-serve motion
A purchase path where users can sign up, get value, and pay without talking to a human. The dominant PLG default, though most successful companies eventually run it alongside a sales-assisted path for larger accounts — a hybrid we cover in the product-led growth playbook.
Signup & onboarding
28. Signup conversion rate
Visitors who create an account divided by visitors who reached the signup entry point. Segment by source and device or the aggregate number will hide everything interesting.
29. Progressive profiling
Collecting user information across multiple steps and sessions instead of in one long form. Reduces initial friction while still building a usable profile — ask for the company size after the user has seen value, not before.
30. Social sign-on (SSO / OAuth signup)
Letting users authenticate via Google, Microsoft, GitHub, or similar. Typically lifts signup completion meaningfully, but can hurt downstream data quality if you never collect work email or company context.
31. Time to value (TTV)
Elapsed time from signup to the user experiencing the product's core benefit. The most under-instrumented metric in PLG. Measure it in minutes for self-serve tools, and treat every reduction as a compounding win across the entire funnel.
32. Aha moment
The specific moment a user understands why the product matters to them. Distinct from activation: the aha moment is subjective and qualitative; activation is the measurable behavior you use as its proxy.
33. Onboarding checklist
An in-product list of setup steps that guides new users toward activation, often with progress indicators. Effective when steps are genuinely value-producing; counterproductive when they're a tour of your feature set.
34. Empty state
What a user sees before they've created any data. A blank table is a churn machine. Sample data, templates, and one-click imports routinely produce some of the largest activation lifts we see in client work.
35. Reverse trial
A model where new users get full premium access for a limited window, then downgrade to a free tier rather than losing access entirely. It combines freemium's low friction with a trial's urgency — and it's often the highest-converting of the three common models for products with clear premium value.
36. Freemium
A permanently free tier with feature, usage, or seat limits designed to demonstrate value and create upgrade pressure. Freemium is a distribution strategy with a real cost of goods; it fails when the free tier is either too generous to create upgrade pressure or too crippled to show value.
Activation & retention
37. Activation rate
The percentage of signups who complete your defined activation event within a set window (commonly 7 or 14 days). The definition must be specific and time-bound: "created a workspace, imported data, and invited one teammate within 7 days" — not "engaged with the product."
38. Activation event
The single behavior, or set of behaviors, that best predicts long-term retention. Find it by comparing behaviors of retained vs. churned cohorts in your first two weeks of data, not by guessing in a workshop.
39. Cohort analysis
Grouping users by a shared starting characteristic (signup week, plan, acquisition channel) and tracking their behavior over time. Without cohorts you cannot tell whether your product is improving or your mix is changing.
40. Retention curve
A plot of the percentage of a cohort still active at each subsequent period. The critical question is whether it flattens. A curve that flattens at 30% has product-market fit at that level; a curve that keeps declining has none, regardless of top-line growth.
41. Churn rate
The percentage of customers (or revenue) lost in a period. Distinguish logo churn from revenue churn — losing ten $50 accounts and one $10,000 account are wildly different problems with the same logo count.
42. Net revenue retention (NRR)
Revenue from an existing cohort at period end divided by period start, including expansion, contraction, and churn. Above 100% means your existing base grows without new acquisition. NRR is the single most predictive number for a PLG company's long-term efficiency.
43. Engagement depth
How much of the product's value surface a user touches — features used, sessions per week, records created. Rising depth generally precedes expansion; falling depth generally precedes churn, which makes it a useful early-warning input.
44. Habit loop
A trigger → action → reward cycle that pulls users back without marketing prompts. In PLG, weekly-frequency products retain far better than monthly-frequency ones, so finding a legitimate weekly trigger is often more valuable than any feature.
Monetization & pricing
45. Trial-to-paid conversion rate
Trials that convert to paying customers, divided by trials started. Segment by whether a credit card was required at signup — the two numbers are not comparable, and mixing them is a classic way to fool yourself.
46. Free-to-paid conversion rate
The share of free-tier users who ever upgrade. Typically much lower than trial-to-paid and measured over months rather than days. Judge it against the cost to serve the free tier, not against trial benchmarks.
47. Paywall
The gate between free and paid capability. Its design — what it blocks, when it appears, and how clearly it explains value — is one of the highest-leverage CRO surfaces in any PLG product, and among the least tested.
48. Usage-based pricing
Charging as a function of consumption (API calls, seats active, transactions processed). Aligns price with value and supports strong NRR, but complicates forecasting and requires accurate metering infrastructure before it can be trusted.
49. Value metric
The unit you charge for. The right value metric grows naturally as the customer gets more value from your product. Choosing it badly caps your expansion revenue permanently, no matter how good your CRO gets.
50. Customer acquisition cost (CAC)
Total sales and marketing spend divided by new customers acquired in the same period. In PLG, allocate a share of product and engineering cost that exists purely to drive self-serve acquisition, or your CAC will flatter you.
51. CAC payback period
Months required for gross-margin-adjusted revenue from a new customer to cover their acquisition cost. It's the sharpest constraint on how fast you can grow without additional capital, and it belongs on your dashboard next to conversion rate.
Expansion & virality
52. Expansion revenue
Additional revenue from existing customers via upgrades, seats, or usage growth. Mature PLG companies commonly source the majority of net new revenue here rather than from new logos.
53. Product-qualified account (PQA)
The account-level equivalent of a PQL: an organization whose aggregate usage signals readiness for a paid or higher-tier conversation. Essential once multiple users from one company sign up independently — which is exactly what a working PLG motion produces.
54. Viral coefficient (k-factor)
Average number of new users each existing user generates: invites sent per user × invite conversion rate. A k above 1 means self-sustaining growth. Almost nobody has that; most good products land at 0.2–0.5 and treat it as a CAC reducer rather than a growth engine.
55. Network effects
When the product becomes more valuable to each user as more users join. Distinct from virality, which is about acquisition mechanics. Collaboration tools have both; single-player analytics tools usually have neither.
56. Land and expand
Entering an account through a small self-serve foothold, then growing seats and spend over time. The core PLG enterprise motion, and the reason NRR matters more than initial deal size.
Measurement & tooling
57. Event tracking
Recording discrete user actions with properties, forming the raw material of all funnel and cohort analysis. A documented, enforced tracking plan — consistent naming, defined properties, an owner — is worth more than any analytics tool you buy.
58. Feature flag
A runtime toggle that turns functionality on or off for a defined population without redeploying code. Feature flags are the infrastructure that makes in-product experimentation and safe rollout possible. If your team can't flag a change, you can't really test it.
59. Server-side vs. client-side testing
Client-side tests inject changes in the browser via JavaScript — fast to deploy, prone to flicker, limited to presentation-layer changes. Server-side tests assign variants in application code, which is required for pricing, onboarding logic, algorithms, and anything that touches data. PLG teams need server-side capability, and that requires engineers in the pod.
60. Attribution model
The rules determining which touchpoints get credit for a conversion (first touch, last touch, linear, data-driven). Every model is wrong in a specific way. Pick one, document it, and pair it with incrementality tests or geo holdouts for spend decisions that actually matter.
Why a shared vocabulary is a growth lever, not admin work
Here's the pattern we see across engagements: a company has a "conversion problem," runs three months of landing page tests, and moves nothing — because the real leak was between signup and first value, and no one owned that surface. Marketing couldn't touch in-product onboarding. Product had no experimentation infrastructure. Data couldn't reconcile the two teams' definitions of activation. The vocabulary gap was a symptom of an ownership gap.
Three practical steps that fix most of it:
- Write one funnel definition document. Every stage, its exact event definition, its current rate, and its named owner. One page. Review it monthly.
- Instrument time to value and activation before you test anything. If you can't see the middle of the funnel, you'll optimize the ends and wonder why revenue is flat.
- Get server-side testing capability. The experiments that move NRR and trial-to-paid live in application logic, not in a JavaScript snippet.
That last point is why we built Growaton the way we did — product, engineering, data, experimentation, and marketing in one senior pod, shipping weekly. The highest-leverage CRO work in a PLG company almost always requires code, and the moment your growth team has to file a ticket and wait two sprints, your experiment velocity collapses to zero.
If you want an outside read on where your funnel is actually leaking, our free growth diagnostic conversation walks your numbers stage by stage against the definitions above. You can also see how we've applied this in client case studies or read through our four-phase approach — Diagnostics, Measurement, Conversion, Scale.