The short answer: the highest-ROI growth automations are not "AI writes your blog posts." They're small, boring, plumbing-level workflows that remove a human handoff from a process that already works — lead routing, research enrichment, churn signals, ad creative iteration, support-ticket triage. Below are 43 plays we've built or repeatedly deployed inside embedded growth pods, organized by funnel stage, with the trigger, the tooling shape, and the metric each one should move. Steal them.
We at Growaton maintain this library because most teams asking "how do we use AI?" are asking the wrong question. The right question is: where in our revenue system does a human currently wait on another human? That's where automation pays back. Everything else is a demo.
How to Read This Library (and Not Waste a Quarter)
Every play below follows the same skeleton, because every durable automation does:
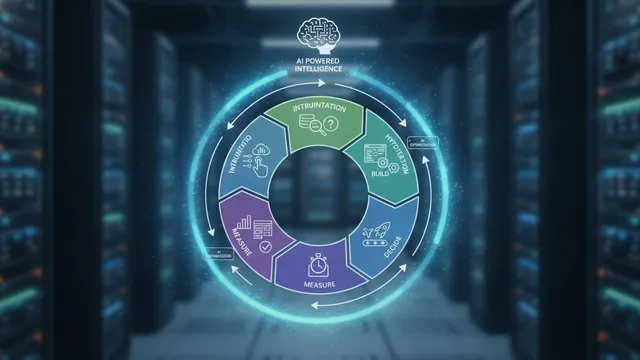
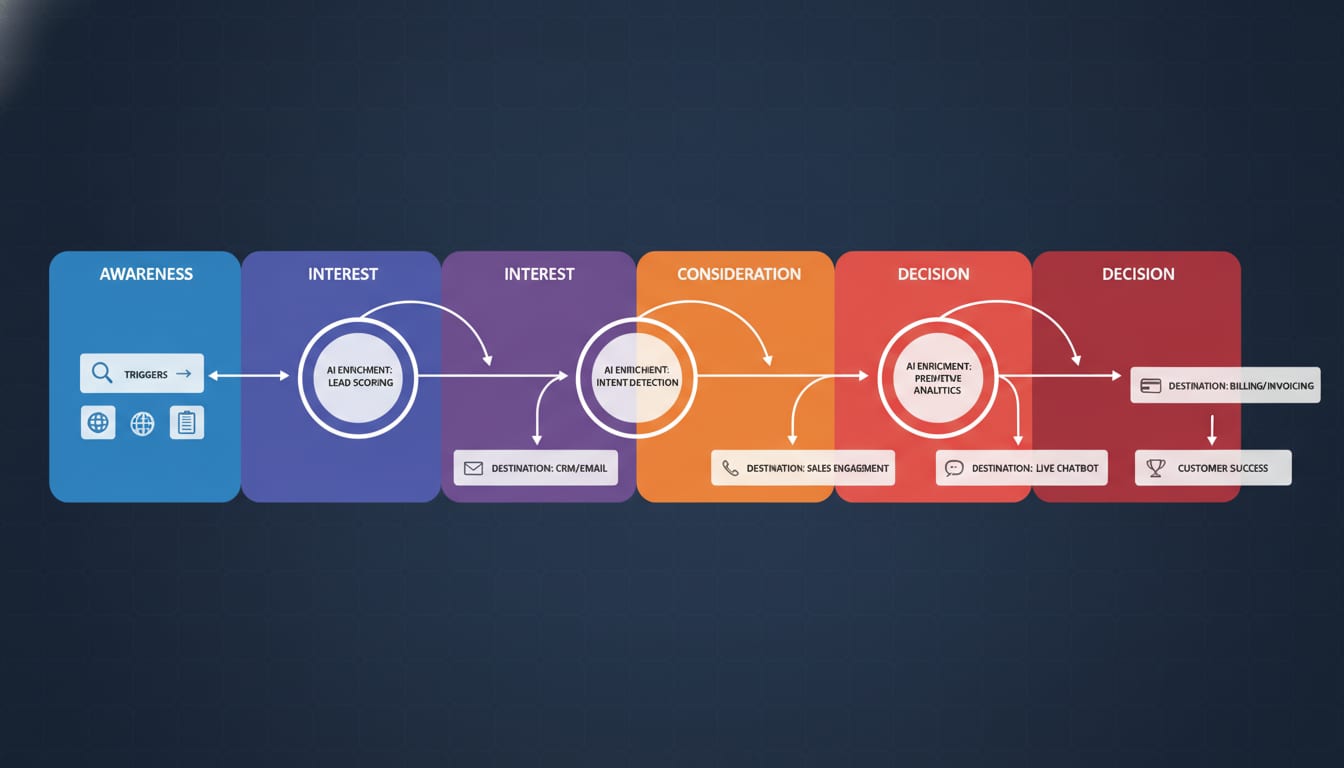
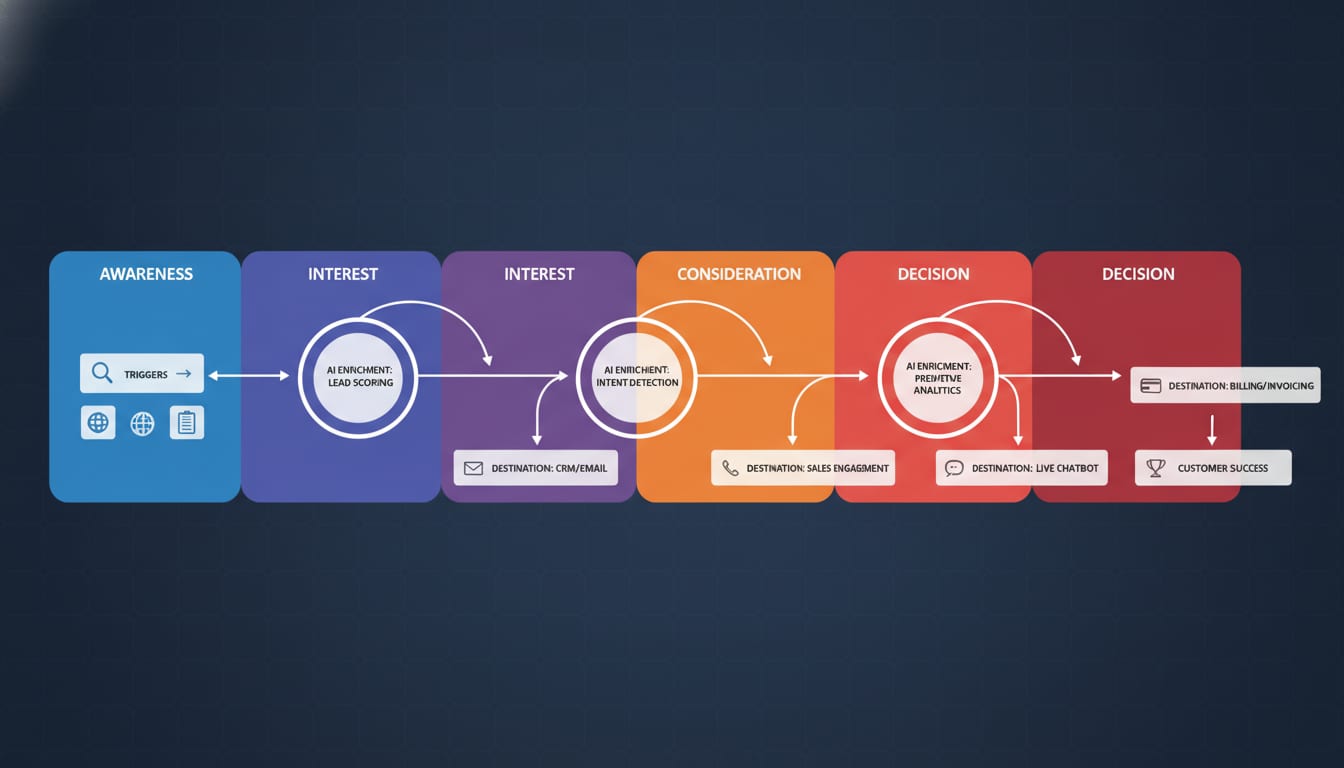
Trigger → Enrich → Decide → Act → Log
- Trigger: an event that already happens (form fill, signup, ticket, price change, calendar booking, Stripe webhook).
- Enrich: add context — firmographics, product usage, CRM history, transcript, page content.
- Decide: the AI step. Classify, score, summarize, generate, or route. This is the only place an LLM belongs, and it should be narrow.
- Act: write to a system of record. Slack, CRM, email, ad platform, database, ticket.
- Log: record inputs, outputs, cost, and a human override flag. Without this you cannot compute ROI, and you will get asked.
If a play you're considering doesn't have all five, it's a science project. The "Log" step is the one teams skip, and it's the one that determines whether your AI spend survives the next budget review. (If you're building that business case, our deeper treatment lives in The ROI of AI: How to Prove Your LLM Spend Actually Pays Back.)
The three tiers of automation maturity
| Tier | What it looks like | Build time | Typical payback |
|---|---|---|---|
| Tier 1 — Assist | AI drafts, human approves and sends. Zero write access to production systems. | Hours to 2 days | Time saved; 2–6 weeks |
| Tier 2 — Route & score | AI classifies/scores, system acts on the classification. Human reviews exceptions. | 3–10 days | Cycle-time and conversion lift; 1–2 months |
| Tier 3 — Closed loop | AI generates, deploys, measures, and iterates against a target metric with guardrails. | 2–6 weeks | Compounding; 1–2 quarters |
Start at Tier 1 on any new play. Promote it to Tier 2 only after you've reviewed 50+ outputs and the error rate is boring. Jump straight to Tier 3 only where the cost of a wrong answer is low and reversible (ad copy variants, subject lines, internal summaries) — never where it's high and public (pricing, billing, legal, security).
A note on tooling. Most of these run on the same small stack: an orchestrator (n8n, Make, Zapier, Temporal, or plain serverless functions), a warehouse or product analytics source, an LLM API, and your CRM. We build custom where the workflow is core IP or needs to be transactional; we use off-the-shelf where it's glue. Don't over-engineer glue.
Category 1: Demand Generation & Top of Funnel (Plays 1–9)
1. Inbound lead research brief
Trigger: demo form submission. Enrich: enrich domain via firmographic API + scrape homepage, pricing page, careers page. Decide: LLM produces a 150-word brief — what they sell, ICP fit rationale, likely pain, two discovery questions. Act: post to Slack channel + attach as CRM note before the call. Metric: demo-to-opportunity rate, rep prep time.
This is the single most reliable first automation we deploy. It's Tier 1, takes a day, and sales teams notice within a week.
2. Lead-to-rep routing by fit and intent
Score inbound on firmographic fit + behavioral intent (pages viewed, docs read, pricing visits), route to the right rep or to a nurture track. The AI's job is only to normalize messy inputs (job titles, company descriptions) into a consistent fit score. Metric: speed-to-first-touch, SQL rate.
3. Programmatic SEO page generation with a human gate
Take a structured dataset you actually own (integrations, locations, job roles, use cases, benchmark data), generate templated pages where the AI writes only the genuinely variable sections, and gate publication behind human review. Thin, mass-generated pages are explicitly targeted by Google's spam policies on scaled content abuse — the differentiator is proprietary data in each page. Metric: indexed pages that earn impressions, not pages published.
4. Content brief generation from SERP + internal knowledge
AI pulls the top 10 results for a target keyword, extracts subtopic coverage gaps, and merges with your internal materials (sales call objections, support tickets) to produce a brief with a genuine angle. Writers still write. Metric: publish velocity, average position within 90 days.
5. Ad creative variant factory
Pull top-performing creative from the last 30 days, extract the winning hook patterns, generate 15 new variants against those patterns, auto-upload as paused ads for human approval. Metric: creative refresh rate, CTR, CAC.
6. Competitor change monitor
Watch competitor pricing, homepage, changelog, and job postings weekly. AI summarizes what changed and what it implies. Act: digest to a Slack channel every Monday. Metric: nothing directly — this is intelligence, and it's still worth the $40/month.
7. Podcast/webinar-to-asset pipeline
One recording → transcript → clip selection → 8 social posts + 1 newsletter section + 1 blog draft + SEO-ready transcript page. Metric: content output per source hour.
8. Review and G2/Capterra response drafting
Draft responses matched to sentiment and specific complaint, human approves. Metric: response rate and time-to-response (both influence marketplace ranking).
9. Event and conference attendee prioritization
Upload the attendee list, enrich, score against ICP, generate personalized outreach angles for the top 50. Metric: meetings booked per event.
Category 2: Outbound & Pipeline (Plays 10–17)
10. Trigger-based outbound from hiring signals
New job posting for a role that implies your problem (e.g. "RevOps Manager" for a data tooling company) → enrich the company → generate an outreach angle referencing the specific req. Metric: reply rate.
11. Funding-round watchlist
Monitor funding announcements in your ICP segments, auto-create CRM records with a research brief and suggested timing. Metric: pipeline sourced from trigger events vs. cold lists.
12. Website visitor de-anonymization follow-up
De-anonymized company visits + pages viewed → AI drafts a contextual message referencing the topic they researched (never the fact you tracked them). Metric: outbound-to-meeting rate.
13. Personalization at the account level, not the contact level
The mistake teams make is generating 500 unique first lines. Better: generate one strong, genuinely researched account-level thesis and reuse it across the 4–6 contacts in the buying committee. Metric: reply rate per hour of research.
14. Reply classification and routing
Classify every reply — interested, not now, wrong person, referral, unsubscribe, hostile — and route accordingly, including automatic suppression list updates. Metric: rep hours reclaimed, deliverability health.
15. Sequence fatigue detector
When a sequence's reply rate drops below a threshold across a rolling window, flag it and generate three replacement variants. Metric: sequence half-life.
16. Call recording → CRM hygiene
Transcript → extract next steps, decision criteria, competitors mentioned, budget signals → write structured fields to CRM. Reps hate CRM data entry; this is the highest-adoption automation in most sales orgs. Metric: opportunity field completeness, forecast accuracy.
17. Deal-risk digest for pipeline review
Weekly, scan open opportunities for stalled activity, missing next steps, single-threaded deals, and unaddressed competitor mentions. Output a ranked risk list for the pipeline meeting. Metric: slipped-deal rate.
Category 3: Onboarding & Activation (Plays 18–25)
Activation is where automation compounds hardest, because every improvement applies to every future cohort. If you don't know where you stand, our Activation Rate Benchmarks by SaaS Vertical dataset is a starting point.
18. Signup-to-setup path personalization
Classify the signup (company size, role, stated goal, email domain) and branch the onboarding checklist. A solo founder and a 200-person ops team should not see the same six steps. Metric: activation rate by segment.
19. Stalled-onboarding intervention
If a user hits step 2 and goes quiet for 48 hours, send a message that references the specific step they're stuck on with the specific unblocker. Metric: step-level completion.
20. AI-assisted data import and mapping
The most common activation killer in B2B SaaS is "get your data in." Use an LLM to map arbitrary customer CSV columns to your schema, with confidence scores and a human confirmation UI. Metric: time-to-first-value, import success rate.
21. In-product "explain this" and setup copilot
A scoped assistant with access only to your docs and the user's current state. Scope it narrowly — a general chatbot will hallucinate and erode trust faster than it helps.
22. Empty-state content generation
New workspace with nothing in it converts badly. Generate a plausible starter template based on the user's industry and role so they see the product working before they've done work. Metric: day-1 core action completion.
23. Trial-behavior scoring for sales handoff
Score trials on depth-of-use signals, not just logins. Route the top decile to a human; leave the rest in automated nurture. Metric: sales efficiency (meetings per closed deal).
24. Support ticket → onboarding friction backlog
Cluster support tickets weekly, tag them to onboarding steps, and auto-file the top three clusters as product tickets. Metric: tickets per new account.
25. Activation retro generator
Weekly, compare this cohort's step-level funnel to the trailing four-week average and surface any step that moved more than a set threshold. Metric: detection lag on regressions.
Category 4: Conversion & Experimentation (Plays 26–32)
26. Experiment brief generator
Feed the AI your funnel data plus a hypothesis, get back a structured brief: metric, MDE, required sample, duration estimate, primary and guardrail metrics, implementation notes. Kills half the ambiguity in experiment planning. Metric: experiments shipped per month.
27. Landing page variant generation against message-market fit hypotheses
Not "write me 10 headlines." Instead: take three distinct positioning hypotheses, generate a full-page variant per hypothesis, test messages against each other rather than word choice. Metric: page-level conversion rate, and more importantly, learning per test.
28. Session replay triage
Sample replays where users abandoned a key flow, have a vision-capable model classify the failure mode, and cluster. Turns 400 replays nobody watches into five ranked friction themes. Metric: friction issues identified per hour.
29. Form and checkout error clustering
Parse client-side validation and payment failure logs, cluster by root cause, rank by revenue impact. Fintech and e-commerce teams routinely find 1–3% of revenue leaking here.
30. Pricing page objection harvester
Mine sales calls, chat logs, and churn surveys for pricing objections, cluster them, and map each to a page change or a proof asset. Metric: pricing-page-to-trial rate.
31. Automated experiment readout drafting
When a test reaches its sample threshold, pull results and draft a readout with the decision recommendation and confidence caveats. A human makes the call. Metric: decision latency after test conclusion — usually the biggest hidden tax on experiment velocity.
32. Localization and market-variant generation
Generate localized page and email variants, human-reviewed by a native speaker before publishing. Metric: conversion rate in secondary markets.
Category 5: Retention, Expansion & Lifecycle (Plays 33–38)
33. Churn-risk signal composite
Combine usage decline, support sentiment, champion departure (via job-change data), and billing events into a single risk score with the top contributing factor named. Act: CS task with a suggested play. Metric: gross revenue retention, save rate.
34. Expansion-signal detection
Seat-limit approaches, feature-gate hits, usage overages, new-department activity. Route to CS or self-serve upgrade prompts. Metric: net revenue retention.
35. QBR and account-review pack generation
Auto-assemble usage trends, value delivered, open issues, and expansion opportunities into a draft deck. Saves CSMs 2–4 hours per account. Metric: QBR coverage rate.
36. Win-back segmentation
Classify churned accounts by churn reason from all available evidence, and only re-engage the segments whose reason has since been fixed. Metric: win-back conversion; wasted-send reduction.
37. NPS and survey open-text coding
Automatically theme and quantify free-text feedback, tracked over time. Turns qualitative sentiment into a trendable series. Metric: theme volume trends.
38. Renewal-risk digest for leadership
Ninety days out from every renewal, produce a risk-ranked list with rationale. Metric: forecast accuracy on renewals.
Category 6: RevOps, Data & Internal Leverage (Plays 39–43)
39. CRM data hygiene agent
Nightly: dedupe, normalize job titles and industries, fill missing firmographics, flag records that contradict themselves. Bad CRM data silently corrupts every downstream automation on this list. Do this early.
40. Natural-language metrics assistant over the warehouse
A read-only, semantic-layer-constrained interface so anyone can ask "what was activation rate for fintech signups last month?" The guardrail matters: point it at a governed metrics layer, not raw tables, or you'll get confidently wrong numbers. Shared definitions help too — see our Growth Metrics Glossary.
41. Anomaly detection on core metrics with narrative explanation
Statistical detection on signups, conversion, CAC, and churn, plus an LLM step that segments the anomaly and proposes likely causes. Metric: mean time to detect.
42. Spend and unit-economics reconciliation
Stitch ad platform spend to CRM-attributed revenue weekly, flag channels drifting outside CAC payback targets. Cross-reference against SaaS benchmarks by ARR stage rather than vibes.
43. Meeting-to-action-item router
Every internal meeting transcript → owned action items in your project tracker, with owners and due dates. Unglamorous, immediate payback, and the one play that improves every other play by making follow-through automatic.
What Actually Determines Whether These Work
We've deployed variants of most of these across SaaS, fintech, marketplace, and e-commerce clients. The pattern in what succeeds is consistent and slightly deflating:
1. The workflow existed before the AI did. Automating a broken process makes it break faster. If your lead routing rules are wrong, an AI that applies them 200x faster is a liability. Fix the process on paper first.
2. Narrow prompts beat clever ones. A classification task with five defined output categories and three examples outperforms an open-ended "act as a growth expert" prompt every time. Constrain the output format. Validate it programmatically.
3. Cost lands where you don't expect. In our experience the LLM API bill is rarely the dominant cost — engineering time, data cleanup, and human review are. Budget accordingly, and instrument per-workflow cost from day one. Model prices have fallen sharply and continue to; Stanford HAI's AI Index has documented order-of-magnitude declines in inference cost for comparable capability. Which means the constraint on your automation roadmap is engineering throughput, not token spend.
4. Human review is a feature, not a transitional cost. The teams getting the most out of AI aren't the ones who removed humans; they're the ones who moved humans from producing to judging. That's the whole game. A reviewer who checks 40 AI-drafted briefs an hour is worth more than one who writes four.
5. Nothing ships without a measurement plan. If you can't state which number the play should move and how you'll know, don't build it. This is the discipline our 4-phase framework enforces — diagnostics before measurement before conversion before scale — and it's the reason we can kill automations that don't earn their keep instead of maintaining them out of sunk-cost sentiment.
A realistic 90-day build order
| Weeks | Focus | Plays to start with |
|---|---|---|
| 1–2 | Instrumentation and data hygiene | 39, 43, plus event tracking audit |
| 3–4 | Two Tier-1 assists with visible wins | 1, 16 |
| 5–8 | Funnel-critical Tier-2 routing | 2, 19, 33 |
| 9–12 | First closed-loop and measurement layer | 5 or 27, plus 41 and 42 |
Resist the urge to build ten workflows at once. Three that people actually use beat ten that quietly rot. And every workflow you build is one you have to maintain when an API changes — treat your automation stack like production software, because it is.
Where This Fits in a Growth System
A workflow library is not a growth strategy. It's leverage applied to a strategy. The teams that get outsized returns from these plays are the ones who already know which stage of their funnel is the constraint — and then automate there rather than everywhere.
That's the model we run at Growaton: one embedded pod with product, engineering, data, experimentation, and marketing in the same room, shipping weekly. Automation isn't a separate workstream in that setup; it's how a small senior team covers ground that would otherwise need three agencies and four handoffs. If you want a comparison of that model against the alternatives, we wrote up growth agency vs. embedded pod vs. in-house in detail, and our case study library shows what the weekly cadence produces over a quarter.
If you've read this far and you're not sure which three plays matter for your funnel, that's exactly the question a free growth diagnostic conversation is for. We'll map your funnel, name the constraint, and tell you which automations are worth building — including the ones that aren't.