The short answer: Your LLM ROI is the fully-loaded value of AI-produced output minus the fully-loaded cost of producing it — where "cost" includes tokens, retries, evaluation, engineering time, and the human review that nobody budgets for. For most growth teams we work with, token spend is 15–30% of true AI program cost. The rest is people. If your calculator only multiplies tokens by price-per-million, you're modeling the cheapest part of the problem.
This article gives you the full model: the input variables that matter, the formulas, worked examples across three real use cases, and the benchmark ranges we see inside seed–Series C startups. Use it to build your own spreadsheet in about 20 minutes, or to sanity-check the AI line item your finance lead just flagged.
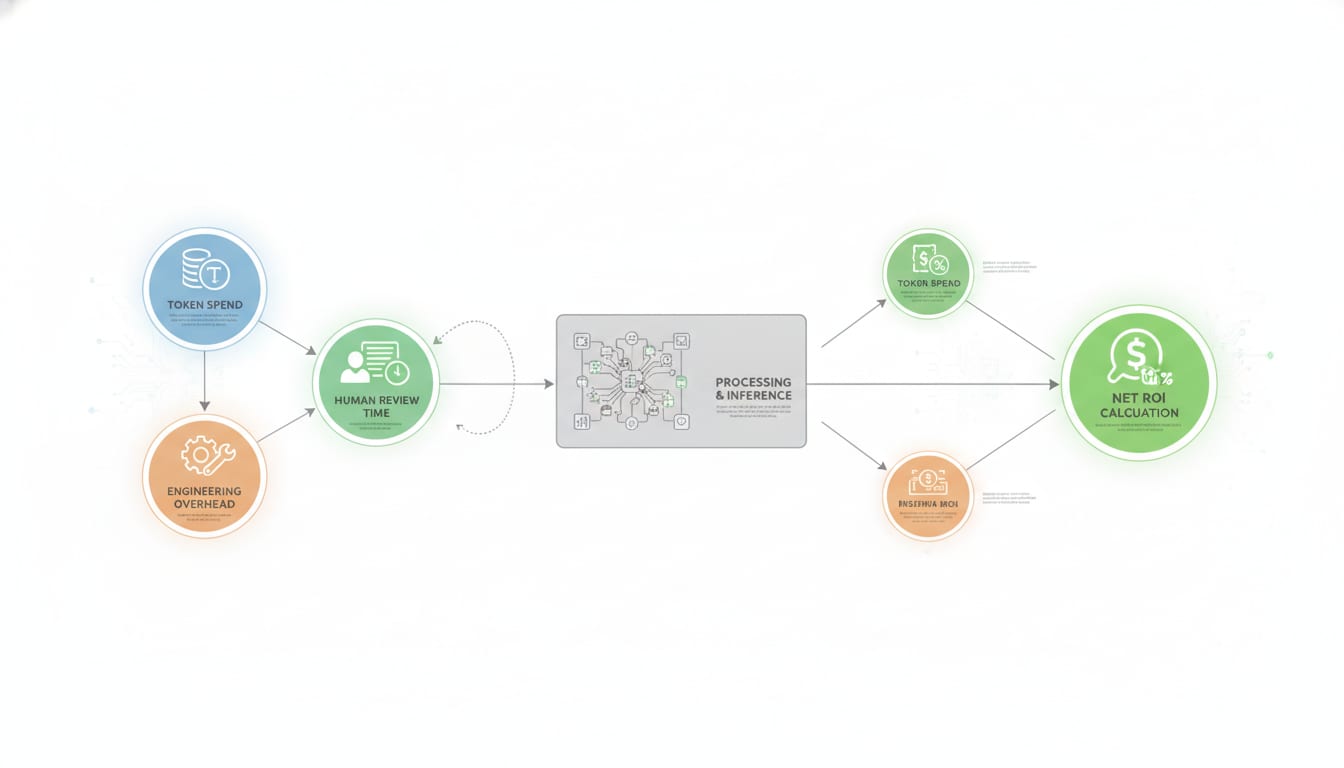
The Core Formula (Start Here)
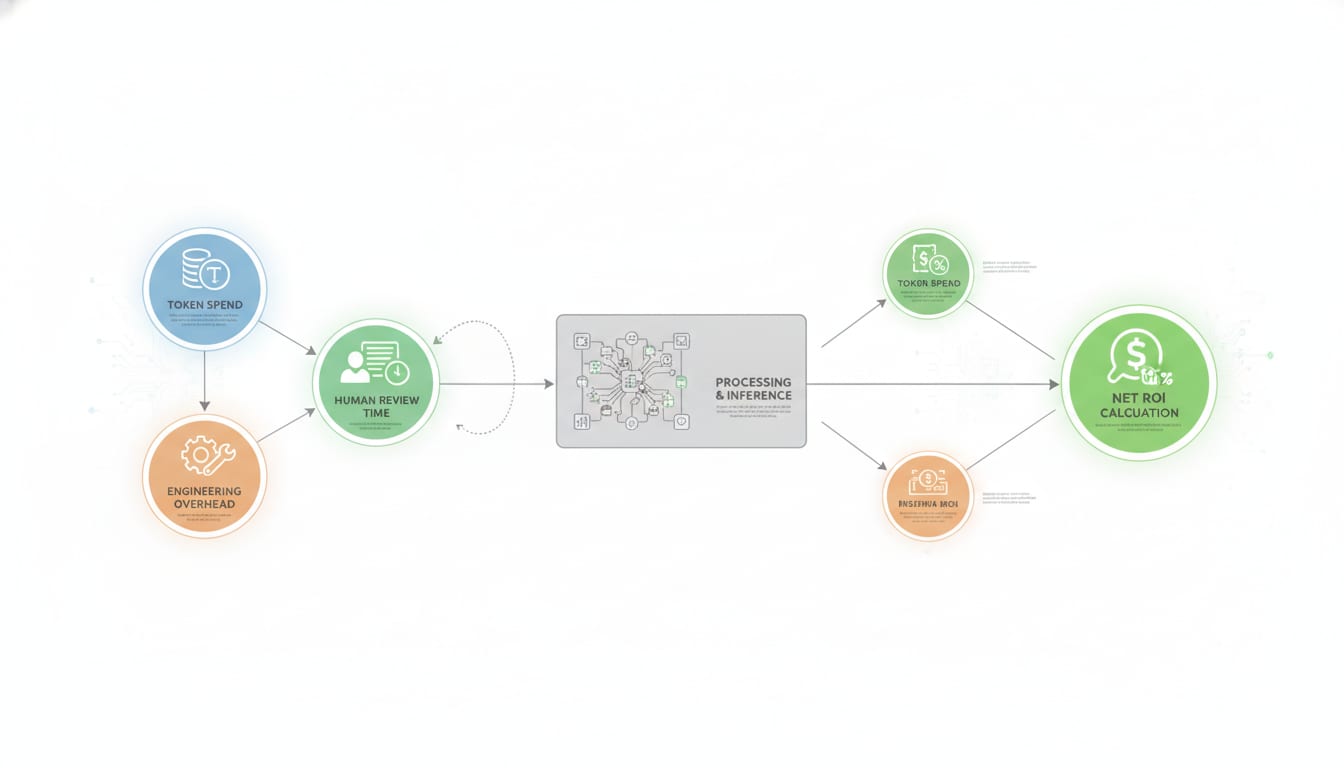
Every credible LLM ROI model reduces to five terms:
Net ROI ($) = (Value Created) − (Token Cost + Infra Cost + Human Cost + Build & Maintain Cost)

ROI (%) = Net ROI / Total Cost × 100
Where:
| Term | What it means | How to source the number |
|---|---|---|
| Value Created | Revenue lifted, cost avoided, or hours redeployed × loaded hourly rate | Attribution data, before/after cycle times, headcount avoided |
| Token Cost | Input tokens + output tokens + cached/reasoning tokens, × unit price | Provider dashboard or usage field in API responses |
| Infra Cost | Vector DB, orchestration, observability, egress, embeddings | Vendor invoices |
| Human Cost | Review, editing, QA, prompt iteration, escalation handling | Time-tracking or honest estimate × loaded rate |
| Build & Maintain Cost | Engineering to ship it + ongoing eval and drift work | Sprint accounting, amortized over 12 months |
The mistake we see most often: teams calculate the first four terms and skip the fifth entirely, then wonder why the "$400/month AI workflow" consumed a quarter of an engineer's capacity.
Step 1: Model Token Cost Correctly
Token pricing is published and stable enough to model precisely. As of early 2026, list prices from the major providers span roughly two orders of magnitude — see OpenAI's pricing page, Anthropic's pricing, and Google's Gemini API pricing for current figures.
The token cost formula
Token Cost per Call = (Input Tokens ÷ 1,000,000 × Input Price)
                    + (Output Tokens ÷ 1,000,000 × Output Price)

Monthly Token Cost = Token Cost per Call × Calls per Month × (1 + Retry Rate)
Four multipliers people forget:
- Output tokens cost 3–5× input tokens on most frontier models. A workflow that generates long-form output is priced very differently from one that classifies.
- Retry and failure rate. Budget 10–25% overhead for timeouts, schema validation failures, and re-runs. In production agentic workflows we've seen it exceed 40% before hardening.
- Reasoning tokens. Extended-thinking modes bill hidden intermediate tokens that can be 2–10× the visible output. If you're using a reasoning model, model output tokens at 3× your visible output as a starting assumption and correct with real usage data.
- Context bloat. RAG pipelines that stuff 20 retrieved chunks into every call multiply input tokens silently. This is the single most common source of "why did our bill triple" in the teams we audit.
Rough token math you can memorize
One token ≈ 4 characters ≈ 0.75 words in English. So:
- A 500-word blog draft ≈ 670 output tokens
- A 10-page PDF of context ≈ 5,000 input tokens
- A 50-message support thread ≈ 3,000–4,000 input tokens
Prompt caching and batching change the answer
Two levers materially move the model and are underused:
- Prompt caching discounts repeated input context — typically 50–90% off cached input tokens depending on provider. If your system prompt and retrieved corpus are stable across calls, this is the highest-leverage cost optimization available and requires no quality tradeoff.
- Batch APIs offer roughly 50% discounts for non-real-time jobs. Anything that runs nightly — enrichment, classification, summarization, scoring — should be batched.
We've cut token spend 60%+ on client workloads with caching and batching alone, before touching model selection.
Model tiering is where the real savings live
The single biggest cost variable isn't provider — it's whether you're routing every request to a frontier model. A realistic tiering policy:
| Task type | Recommended tier | Typical cost index |
|---|---|---|
| Classification, routing, extraction, tagging | Small/cheap model | 1× |
| Summarization, first-draft copy, enrichment | Mid-tier model | 5–15× |
| Multi-step reasoning, code generation, high-stakes judgment | Frontier model | 30–100× |
A cascade — cheap model first, escalate to frontier only on low confidence — routinely cuts blended cost per task by 70–85% while holding output quality, because the majority of real production traffic is easy.
Step 2: Model Human Cost (The Term Everyone Skips)
This is where LLM ROI models actually break. AI output that requires human review isn't free output — it's output at a discount.
Human Cost per Unit = Review Minutes ÷ 60 × Loaded Hourly Rate
Effective Cost per Unit = Token Cost per Unit + Human Cost per Unit
A loaded hourly rate for a US-based marketing manager at $110K salary is roughly $75–85/hour once you include benefits, tax, and overhead (commonly modeled at 1.25–1.4× base). At $80/hour, every minute of human review costs $1.33 — which is more than most single LLM calls.
Concretely: if an AI-drafted blog post costs $0.40 in tokens but needs 90 minutes of editing, your true cost is $120.40. The AI saved you time versus writing from scratch, but the token line item is 0.3% of the story.
The quality-adjusted output rate
The honest denominator isn't "units generated," it's "units shipped."
Quality-Adjusted Output = Units Generated × Acceptance Rate
True Cost per Shipped Unit = Total Cost ÷ Quality-Adjusted Output
If you generate 100 outreach emails, 55 pass review, and 45 are discarded, you paid for 100 and shipped 55. Your cost per shipped unit is 1.8× your naive estimate. Track acceptance rate as a first-class metric — it's the variable most responsive to prompt and eval investment, and improving it from 55% to 80% is usually cheaper than switching models.
Step 3: Model Value Created
Three value types, three different formulas. Pick the one that matches your use case and resist the urge to claim all three.
Cost avoidance (hours redeployed)
Value = Hours Saved per Month × Loaded Hourly Rate
Critical honesty check: hours saved only become value if they're redeployed to something that generates revenue or eliminated from payroll. If your SDR now writes emails in 10 minutes instead of 40 and uses the extra 30 to browse LinkedIn, you saved nothing. We insist clients name the specific activity absorbing the reclaimed time before we count it.
Revenue lift (throughput or conversion)
Value = Incremental Units × Conversion Rate × Average Contract Value
This is where AI ROI actually gets big, because it's not capped by headcount cost. A team that ships 4x more experiments doesn't save 4x labor — it finds more winners. This is the same logic behind our Experiment Velocity Calculator: throughput compounds into learning, and learning compounds into revenue.
Speed-to-value (cycle time compression)
Value = Days Saved × Daily Revenue Contribution of the Initiative
Shipping a pricing page test three weeks earlier isn't a labor saving — it's three weeks of incremental conversion you'd otherwise never have collected. Underrated and often the largest term.
Three Worked Examples
Realistic ranges based on patterns we see across SaaS, fintech, and e-commerce pods. Your numbers will differ; the structure shouldn't.
Example 1: Support ticket triage and drafting (SaaS, Series A)
| Input | Value |
|---|---|
| Tickets/month | 4,000 |
| Avg input tokens/ticket (thread + KB context) | 4,500 |
| Avg output tokens/ticket (draft reply) | 400 |
| Model | Mid-tier, with prompt caching on KB |
| Effective blended token cost/ticket | ~$0.009 |
| Retry overhead | 12% |
| Monthly token + infra cost | ~$95 |
| Human review minutes/ticket (before → after) | 8 → 3 |
| Loaded agent rate | $45/hr |
| Acceptance rate | 82% |
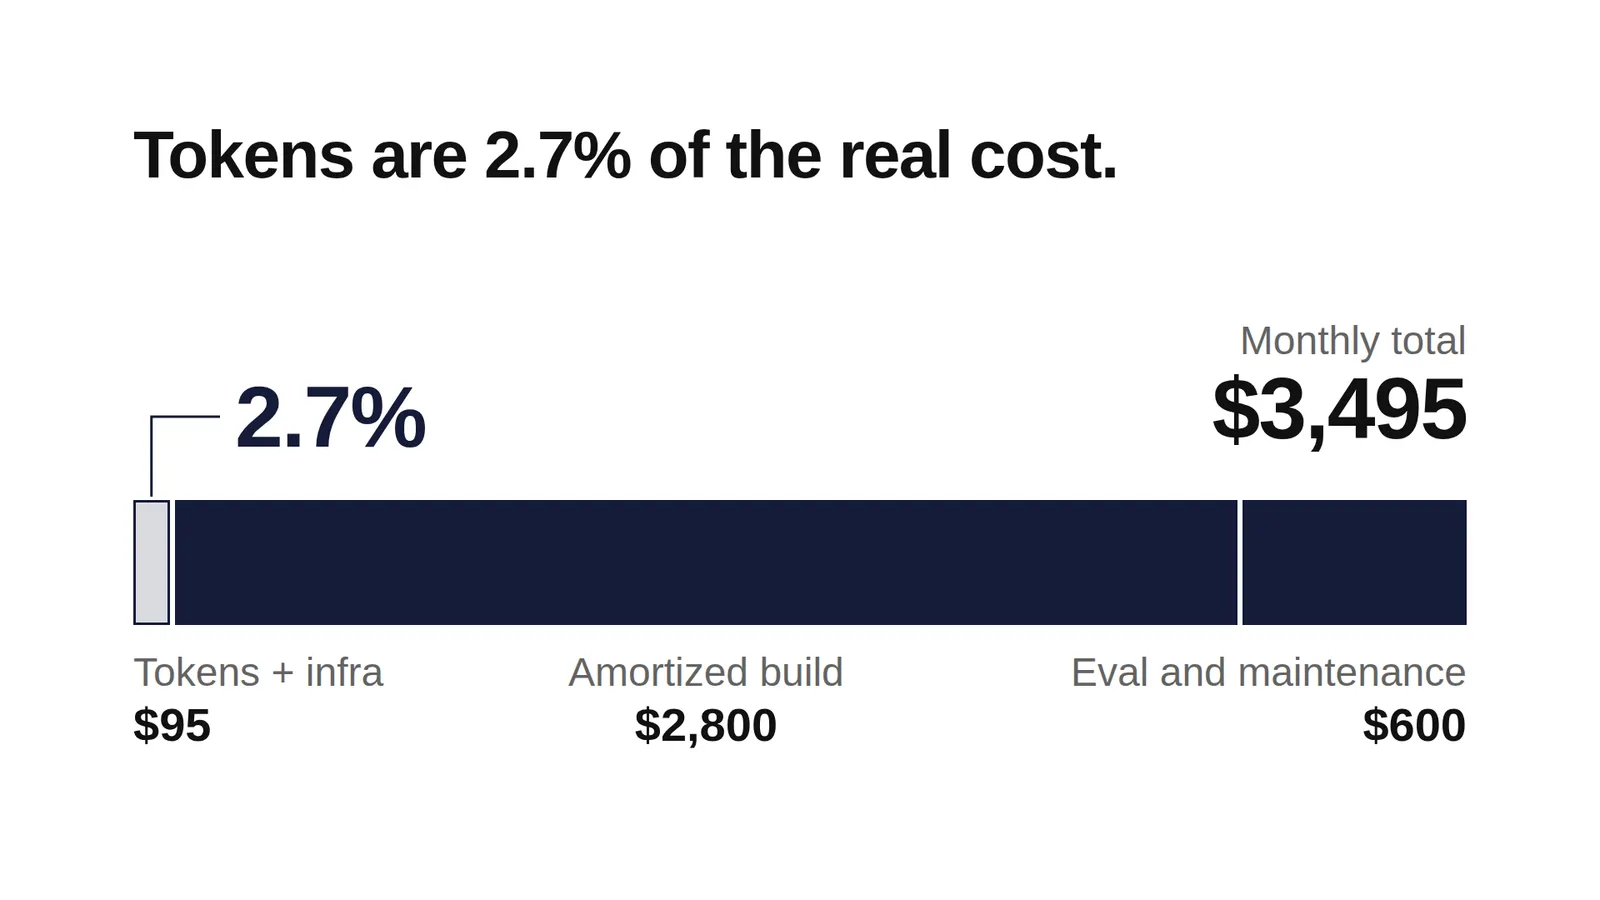
Value: 4,000 tickets × 5 min saved = 333 hours × $45 = $15,000/month in capacity. Costs: $95 tokens/infra + $2,800 amortized build (4 eng-weeks over 12 months) + $600/mo eval and maintenance = $3,495. Net: ~$11,500/month. ROI: 329%.
Note the shape: tokens are 2.7% of cost. Engineering and maintenance are 97%. Anyone modeling this with a token calculator alone would be off by a factor of 36.
Example 2: AI-assisted content production (marketplace, seed)
| Input | Value |
|---|---|
| Articles/month target | 20 |
| Token cost/article (research + outline + draft + revisions) | ~$3.20 |
| Editor time/article (AI-assisted) | 2.5 hrs |
| Editor time/article (from scratch, baseline) | 6 hrs |
| Loaded editor rate | $70/hr |
| Acceptance rate (drafts that ship) | 75% |
Cost per shipped article: ($3.20 + $175 editor) ÷ 0.75 = $237.60 Baseline cost per article: $420 Savings: $182 × 20 = $3,650/month, against ~$800/month in tooling and workflow maintenance. Net ~$2,850, ROI 356%.
Notice that the ROI here comes almost entirely from editor hours, not tokens — and it collapses if acceptance rate drops below ~55%. Content AI ROI is an acceptance-rate game, not a model-selection game.
Example 3: Autonomous agentic outbound research (fintech, Series B)
| Input | Value |
|---|---|
| Accounts researched/month | 2,500 |
| Avg calls per account (multi-step agent) | 7 |
| Avg tokens/call (incl. reasoning) | 12,000 in / 1,800 out |
| Model | Frontier for synthesis, small model for extraction |
| Retry/failure overhead | 28% |
| Monthly token cost | ~$2,900 |
| Infra (vector DB, orchestration, observability) | $700 |
| Engineering (amortized) + eval | $4,200 |
Value: research quality lifted meeting-book rate from 2.1% → 3.4% on 2,500 accounts = 32 incremental meetings × 22% close rate × $28K ACV = $197K in pipeline value, or roughly $43K in expected revenue per month at that close rate. Costs: $7,800. ROI: 451%.
This is the highest-token, highest-ROI case — because the value term is revenue, not labor. The lesson generalizes: AI applied to revenue-generating throughput outperforms AI applied to cost reduction, usually by an order of magnitude.
Benchmark Ranges We See in Practice
| Metric | Weak | Acceptable | Strong |
|---|---|---|---|
| Token cost as % of total AI program cost | >50% (likely over-modeling) | 15–30% | <15% with high value term |
| Acceptance rate (human-reviewed output) | <50% | 60–75% | >80% |
| Retry/failure overhead | >30% | 10–20% | <10% |
| Payback period on build cost | >12 months | 4–9 months | <3 months |
| Blended ROI, year one | <100% | 150–300% | >350% |
Independent research supports the wide dispersion here. MIT's NANDA initiative report on generative AI in enterprise found that roughly 95% of enterprise GenAI pilots produced no measurable P&L impact — not because the models don't work, but because the workflows around them were never instrumented or integrated. McKinsey's global AI survey reports similar findings: most organizations can't yet attribute EBIT impact to their AI deployments.
That gap is measurement, not capability. Which is the whole point of building the model before you build the workflow.
How to Build This Calculator Yourself in 20 Minutes
A single spreadsheet with four tabs:
Tab 1 — Inputs. Volume/month, avg input tokens, avg output tokens, model price in/out, retry rate, review minutes before, review minutes after, loaded hourly rate, acceptance rate, build hours, blended eng rate, monthly maintenance hours.
Tab 2 — Cost build-up. Token cost per unit → monthly token cost → + infra → + human review → + amortized build (build hours × eng rate ÷ 12) → + maintenance. Output: total monthly cost and cost per shipped unit.
Tab 3 — Value build-up. Pick one primary value type. Compute hours redeployed × rate, or incremental units × conversion × ACV, or days saved × daily revenue contribution. Add a "confidence haircut" cell — we default to 30% — and multiply. Optimistic value assumptions are the number-one cause of AI business cases that don't survive contact with a CFO.
Tab 4 — Sensitivity. A two-variable data table on the two inputs that always dominate: acceptance rate and review minutes after. If your ROI goes negative when acceptance drops 15 points, you have a fragile business case and should invest in evals before scaling volume.
Add one guardrail: a cost-per-unit alert threshold. Instrument your actual usage against the model weekly. Any workflow drifting more than 25% above modeled cost per unit needs a look — usually context bloat or an unnoticed model upgrade.
What the Model Won't Tell You
Three limits worth naming honestly:
- Second-order value is real but unmodelable. Faster iteration changes what a team is willing to attempt. That optionality doesn't fit in a spreadsheet, and pretending otherwise makes your model less credible, not more.
- Price-per-token is falling fast; your human costs aren't. Inference costs have dropped roughly an order of magnitude per year for equivalent capability. Model your token line conservatively for 12 months, then re-baseline — and never architect around a specific model's price.
- A negative ROI model is often a workflow problem, not an AI problem. Nine times out of ten, when we run this model for a client and it comes out negative, the culprit is that AI was bolted onto a broken process. Fix the process, then re-run.
Where This Fits in the Bigger Picture
This calculator is the arithmetic layer. The strategic layer — which workflows to automate, how to instrument attribution so the value term is defensible, and how to sequence build vs. buy — is what we cover in The ROI of AI: How to Prove Your LLM Spend Actually Pays Back, the cornerstone of our AI pillar.
We at Growaton run this exact model in the Diagnostics phase of our 4-Phase Growth Framework before we write a line of code for a client's AI workflow. Then we instrument it in the Measurement phase so the value term isn't a guess six months later. It's the same discipline we apply to attribution work — see how we cut CAC by 47% by rebuilding a Series A SaaS company's attribution model for what that instrumentation looks like in practice.
If you've built the model and the numbers look strong but you don't have the senior engineering capacity to ship it, that's the gap our embedded pods fill — product, engineering, data, and growth in one team, shipping weekly. Book a free growth diagnostic and we'll pressure-test your AI business case against what we've seen work and fail across dozens of implementations. No pitch deck required.