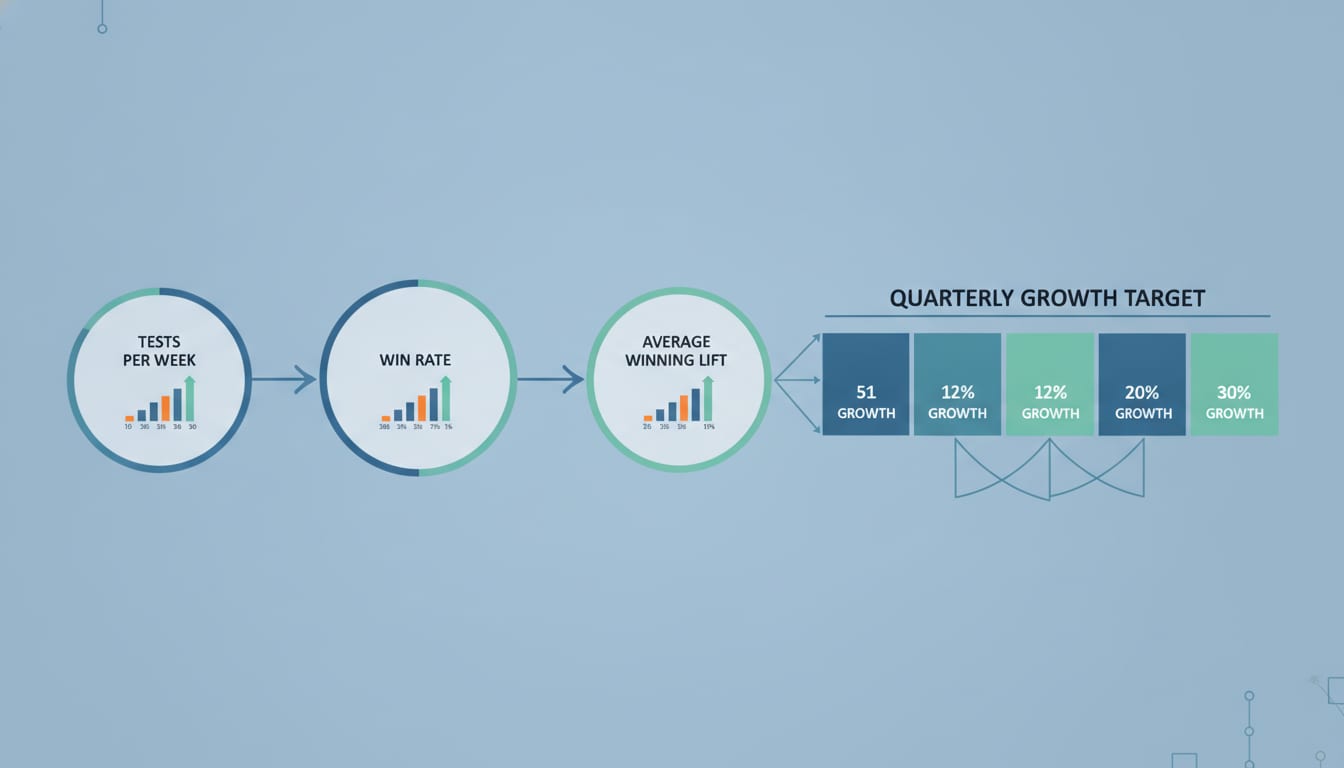
The short answer: to hit a growth target through experimentation, you need enough tests that your expected aggregate lift clears your target. The formula is:
Tests needed = Target lift ÷ (Win rate × Average winning lift)
If you want a 30% lift in trial-to-paid conversion, your team wins on 25% of experiments, and each win averages an 8% relative lift, you need roughly 30 ÷ (0.25 × 8) = 15 shipped experiments. Spread over a quarter, that's about 1.2 experiments per week — and that's the number most teams discover they cannot currently sustain.
That gap between the velocity you need and the velocity you have is the most under-diagnosed problem in growth. We at Growaton run this calculation at the start of nearly every engagement, and the result is almost always uncomfortable: teams are planning for a 3x outcome on a 0.4-experiments-per-week cadence.
This article gives you the full model, the inputs that actually matter, realistic benchmarks to plug in, and what to do when the math says your target is out of reach.
The Experiment Velocity Formula
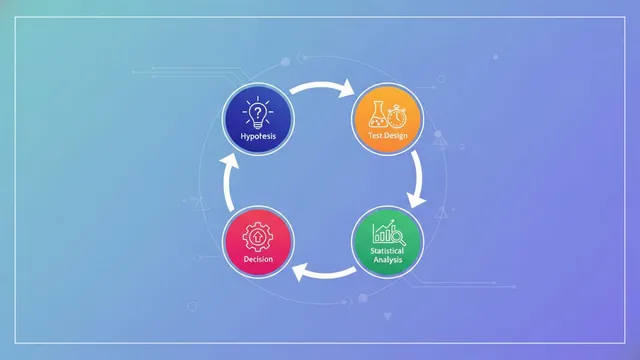
Experiment velocity is the number of valid, decision-ready experiments a team completes in a given period — usually expressed as tests per week. It's not tests launched, and it's definitely not "ideas in the backlog." A test only counts when it reaches a decision: ship, kill, or iterate.
Four variables drive whether your experimentation program hits a growth target:
| Variable | Definition | Typical range (seed–Series C) |
|---|---|---|
| Target lift (T) | Relative improvement you need in the metric | 15%–100% per quarter |
| Win rate (W) | Share of experiments producing a positive, significant result | 10%–35% |
| Average winning lift (L) | Mean relative lift from a winning test | 3%–15% |
| Cycle time (C) | Weeks from build start to decision | 1–4 weeks |
The base calculation
Step 1 — Expected value per experiment:
EV = W × L
Step 2 — Experiments required:
N = T ÷ EV
Step 3 — Calendar time required:
Weeks = N ÷ (concurrent tracks ÷ cycle time in weeks)
Worked example for a Series A SaaS company targeting a 25% lift in activation rate:
- Win rate: 22%
- Average winning lift: 7%
- EV per experiment = 0.22 × 7 = 1.54% expected lift per test
- Tests needed = 25 ÷ 1.54 = 17 experiments
- With 2 concurrent tracks and a 3-week cycle time: 2 ÷ 3 = 0.67 tests/week
- Calendar time = 17 ÷ 0.67 = 25 weeks — roughly six months, not one quarter
The company thought it had a Q1 goal. The math says it has an H1 goal, or it needs to double throughput.
Compounding vs. additive lift
The simple formula above treats lift as additive, which slightly understates results because sequential wins compound. If you ship five wins at 7% each, the true compounded lift is 1.07⁵ − 1 = 40%, not 35%.
But additive is the safer planning assumption, for three reasons:
- Interaction effects. Two wins on the same funnel step rarely stack cleanly. A better headline and a shorter form both reduce the same friction.
- Regression to the mean. Measured lift in a single test overstates true effect, especially when tests are stopped early or underpowered. Research on A/B testing platforms consistently shows that the measured winner's margin shrinks on replication — a phenomenon Ron Kohavi and colleagues discuss at length in Trustworthy Online Controlled Experiments.
- Decay. Novelty-driven wins fade. Onboarding wins tend to hold; promotional-messaging wins often don't.
Growaton's planning rule: model additively, then discount measured lift by 20–30% when forecasting revenue impact. If you need board-facing numbers, use the discounted figure.
Getting Your Inputs Right
The formula is trivial. The inputs are where teams fool themselves.
Win rate: use your own data, not a blog post
Published win rates vary wildly because definitions vary. Microsoft has reported that roughly one-third of ideas produce positive results, one-third are flat, and one-third are negative across its experimentation platform. Booking.com and Airbnb have discussed similarly humbling numbers. For early-stage startups the picture differs in both directions: less optimized surfaces mean bigger available wins, but lower traffic means more inconclusive results.
Practical benchmarks we use for planning when a client has no history:
| Program maturity | Realistic win rate | Avg. winning lift |
|---|---|---|
| First 90 days, unoptimized funnel | 30–40% | 8–15% |
| Established program, 1+ year of testing | 15–25% | 4–8% |
| Highly optimized checkout/pricing surface | 8–15% | 2–5% |
| Net-new feature or pricing experiments | 20–30% | 10–25% (high variance) |
Two calibration notes. First, count inconclusive tests as losses for planning purposes — a flat result costs you the same cycle time. Second, if your reported win rate is above 50%, you almost certainly have a measurement problem: peeking, insufficient power, or wins declared on secondary metrics.
Sample size is the real velocity ceiling
Most teams believe their constraint is engineering capacity. Below roughly 25,000 monthly visitors or 500 monthly conversions on the target step, the constraint is statistical power.
Rough requirement, per variant, for detecting a relative lift at 80% power and 95% confidence:
| Baseline conversion rate | To detect +5% relative | +10% relative | +20% relative |
|---|---|---|---|
| 2% | ~310,000 | ~78,000 | ~20,000 |
| 5% | ~120,000 | ~30,000 | ~7,600 |
| 10% | ~57,000 | ~14,500 | ~3,700 |
| 25% | ~19,000 | ~4,800 | ~1,250 |
(Figures are approximate; use a dedicated sample size calculator for your specific numbers.)
The implication reshapes strategy. If you have 8,000 monthly visitors and a 5% baseline, you can only reliably detect lifts of roughly 20% or more — which means small-optimization A/B tests are off the table. You should be running bigger, bolder swings: repositioned value props, restructured onboarding, new pricing models. Low-traffic teams that insist on button-color tests generate noise, not learning.
This is also why sequential and Bayesian approaches matter for smaller startups: they let you make decisions with explicit risk tolerances rather than waiting for a fixed sample you'll never reach. And when traffic simply isn't there, painted-door tests, qualitative research, and pre/post analysis with holdouts become legitimate parts of the program.
Cycle time: the variable you control most directly
Win rate and average lift are largely properties of your product and market. Cycle time is a property of your operating system — and it's where velocity gains are cheapest.
A typical breakdown of a 3-week cycle at a Series A company:
| Stage | Typical duration | Compressible to |
|---|---|---|
| Idea → prioritized hypothesis | 3–5 days | Same day (standing backlog + scoring rubric) |
| Design & copy | 3–5 days | 1 day (component library, AI-assisted drafts) |
| Build & QA | 5–10 days | 1–3 days (feature flags, pre-built test harness) |
| Runtime to significance | 7–21 days | Fixed by traffic |
| Analysis & decision | 3–7 days | Same day (pre-registered analysis + auto dashboards) |
Everything except runtime is compressible. In practice we routinely cut end-to-end cycle time from three weeks to eight days by eliminating three specific bottlenecks: waiting on a shared engineering sprint, hand-built analytics for each test, and decisions that require a meeting nobody has scheduled.
Concurrency multiplies throughput more than speed does. Two independent tracks at a 2-week cycle time yields 1 test/week. One track at a 1-week cycle time also yields 1 test/week — but is far more fragile. Run concurrent tests on non-overlapping surfaces (acquisition landing pages, onboarding, in-product upgrade prompts, lifecycle email) and you multiply throughput without multiplying risk.
The Calculator: Work Through Your Own Numbers
Use this as a worksheet. Five inputs, five outputs.
Inputs
- Target metric — one number (e.g., trial-to-paid conversion, activation rate, checkout completion).
- Target lift (T) — relative % improvement required, and the deadline.
- Win rate (W) — your trailing 12-month rate, or a benchmark from the table above.
- Average winning lift (L) — your trailing average, or benchmark.
- Throughput — concurrent tracks ÷ cycle time in weeks = tests per week.
Outputs
| Output | Formula |
|---|---|
| Expected lift per experiment | W × L |
| Experiments required | T ÷ (W × L) |
| Weeks required | Experiments required ÷ tests per week |
| Capacity gap | Experiments required − (tests per week × weeks available) |
| Required velocity | Experiments required ÷ weeks available |
Three worked scenarios
Scenario A — Seed-stage fintech, low traffic Target: +40% on onboarding completion in 2 quarters (26 weeks). Win rate 35% (unoptimized funnel), avg. winning lift 14%. EV per test = 4.9%. Tests needed = 8. Current throughput: 1 track, 4-week cycle = 0.25 tests/week → 6.5 tests in 26 weeks. Gap: 1.5 tests. Verdict: achievable with modest cycle-time improvement. Sample size is the binding constraint, so tests must be big swings.
Scenario B — Series A SaaS, PLG motion Target: +30% on trial-to-paid in 1 quarter (13 weeks). Win rate 20%, avg. winning lift 6%. EV per test = 1.2%. Tests needed = 25. Required velocity = 1.9 tests/week. Current: 1 track, 3-week cycle = 0.33 tests/week. Gap: 21 tests. Verdict: the target is off by roughly 6x. Either extend the timeline to a full year, or stop treating this as an optimization problem — a 30% quarterly lift requires structural change (new pricing, new onboarding architecture, a growth loop), not a test series.
Scenario C — Series B e-commerce Target: +12% on checkout completion in 1 quarter. Win rate 15% (optimized surface), avg. winning lift 4%. EV per test = 0.6%. Tests needed = 20. Required velocity = 1.5 tests/week. Current: 3 tracks, 2-week cycle = 1.5 tests/week. Gap: 0. Verdict: on track, with zero slack. Any drop in throughput misses the target — so build in a 20% buffer and target 24 tests.
Scenario B is the most common result we see, and it produces the single most valuable output of this exercise: the honest conclusion that the target cannot be reached by optimization alone. That's not a failure of the calculator. That's the calculator doing its job — redirecting you from A/B tests to growth loops and compounding acquisition mechanics before you burn a quarter.
What to Do When the Math Doesn't Work
There are exactly four levers. Pull them in this order.
1. Raise expected value per test (highest leverage)
Doubling your win rate or your average winning lift halves the number of tests required. Concretely:
- Test bigger hypotheses. Copy tweaks yield 2–4%. Repricing, repackaging, and onboarding restructures yield 10–30%. Same cycle time, 5x the expected value.
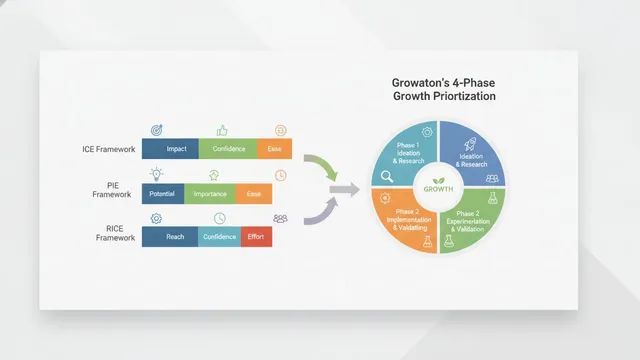
- Prioritize on evidence, not vibes. Frameworks matter here — ICE and RICE are fine starting points, but they systematically over-reward cheap ideas. Our 4-Phase prioritization approach weights diagnostic evidence (do we have data saying this is a real bottleneck?) alongside effort and impact, which is what actually moves win rate.
- Kill faster. A test you stop at day 4 because the guardrail metric collapsed frees a slot. Pre-register your stopping rules.
2. Increase concurrency
Add independent test tracks on non-interacting surfaces. This is usually cheaper than hiring — it requires a test harness, feature flags, and a shared measurement layer, not more headcount. Most teams can run 2–4 concurrent tracks with the people they already have, once the infrastructure exists.
3. Compress cycle time
Target the non-runtime stages. The highest-ROI investments, in our experience:
- A reusable experiment harness (variant assignment, exposure logging, guardrails) so each test doesn't rebuild plumbing.
- Pre-registered analysis templates so results are readable the day the test ends.
- AI-assisted variant production for copy, creative, and landing-page builds — this is where AI-augmented growth ops shows the clearest ROI, cutting design-and-build time by 50–70% on marketing-surface tests.
- A single weekly decision forum with authority to ship. No escalation, no follow-up meeting.
4. Change the target or the timeline
If levers 1–3 still leave a gap, the target is wrong — say so early. A 6-month timeline honestly forecast beats a 3-month timeline that misses. Alternatively, split the target: a portion from experimentation, a portion from a structural bet (new channel, new pricing tier, a referral loop) that isn't gated by test velocity.
A note on what velocity is not
High velocity with low trustworthiness is worse than low velocity. Teams that chase a tests-per-week number start peeking at results, running underpowered tests, and declaring wins on cherry-picked segments. You end up with a portfolio of "wins" that sum to +80% while the actual metric hasn't moved — the clearest possible sign that your measurement is broken. Track two health metrics alongside velocity:
- Decision rate: % of launched tests that reach a documented ship/kill decision. Target >90%.
- Replication rate: of shipped wins, what % hold up in a holdout or post-launch check? Target >60%.
If either drops, slow down.
How Growaton Uses This Model
Every engagement starts with the diagnostic phase of our 4-Phase framework, and this calculation is one of its first outputs. We pull trailing win rate and average lift from whatever experiment history exists, measure real cycle time (not the sprint plan), and put the capacity gap in front of the founder in week one.
The reason we lead with it: the gap almost always explains the frustration. A team isn't underperforming because people aren't trying — it's running 0.3 tests per week against a target that mathematically requires 1.5. No amount of effort closes a 5x throughput gap. Infrastructure, concurrency, and bigger hypotheses do.
That's also the structural argument for an embedded pod over a siloed agency. Cycle time balloons when design waits on a marketing agency, build waits on the next engineering sprint, and analysis waits on a data analyst with four other priorities. Put those functions in one pod with shipping authority and cycle time collapses — which is the whole point of a weekly shipping cadence. In one activation program, that compression is what let us ship 14 experiments in 90 days and 3x activation — 1.1 tests per week, sustained, on a mid-traffic B2B funnel.
If you want to run this against your own numbers with someone who's done it a few dozen times, book a free growth diagnostic. We'll model your required velocity, your actual velocity, and what it would take to close the difference — whether or not you work with us.