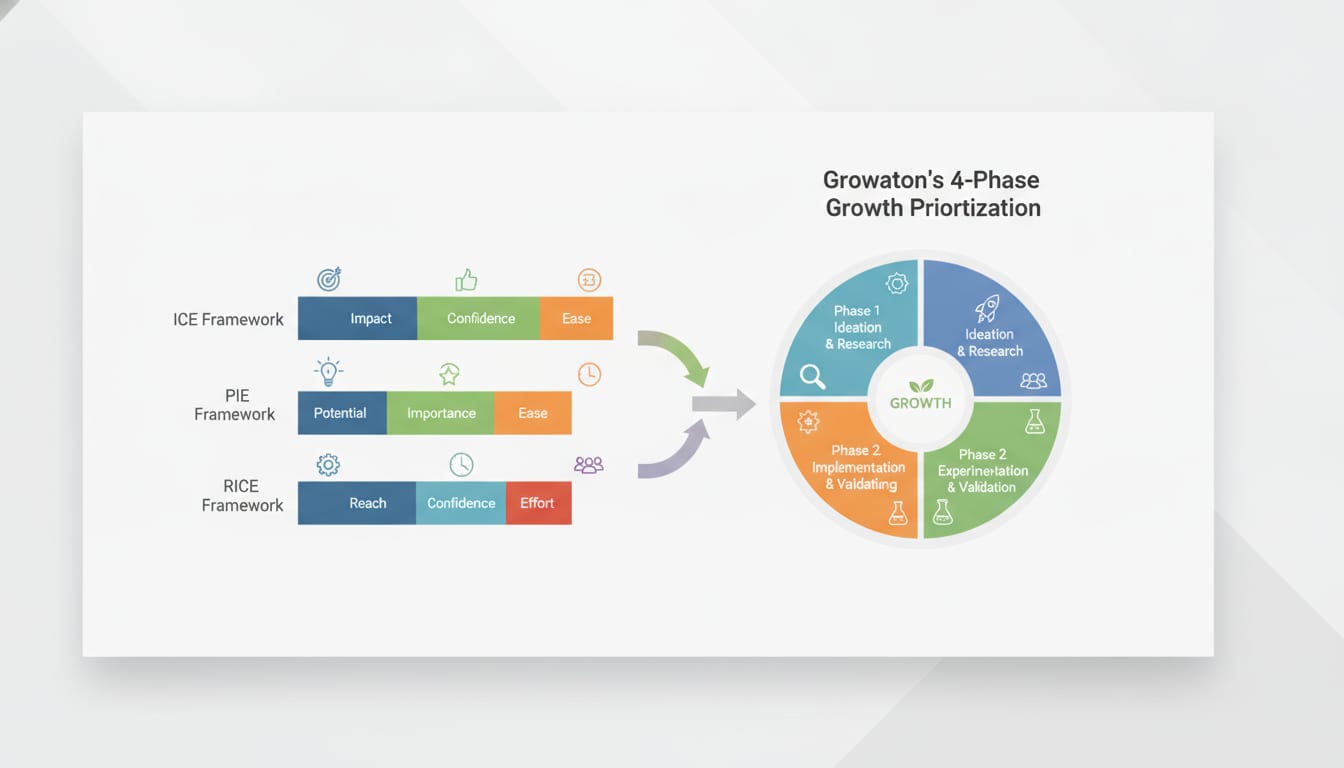
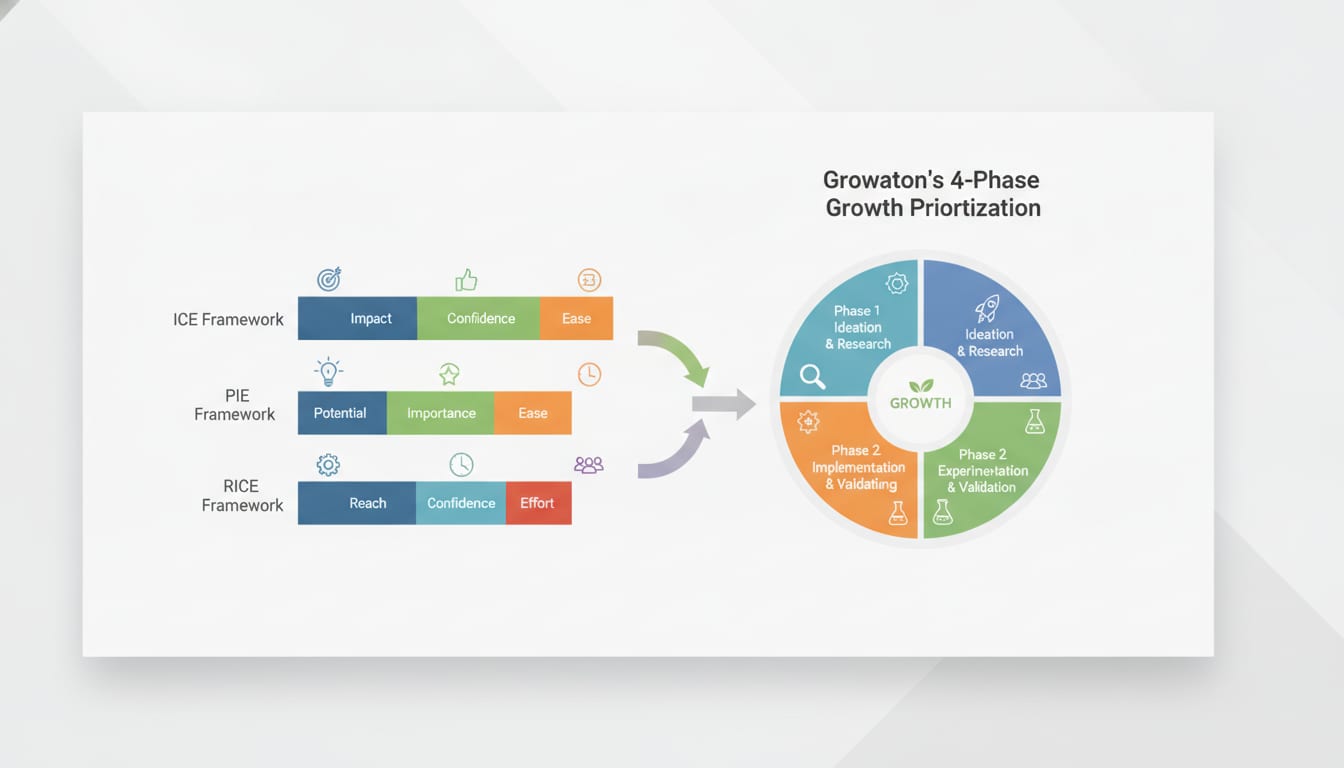
Short answer: ICE is the fastest way to get a scrappy team shipping tests this week. RICE is the best of the classic scoring models when you have real traffic data and need to defend a roadmap. PIE is largely a relic of 2010s CRO, useful only if your growth work is confined to landing-page optimization. And none of the three tell you what kind of work you should be doing right now — which is why we at Growaton built our 4-Phase Prioritization model on top of them.
If you're picking a framework today: use ICE below ~10k monthly visitors, switch to RICE when you can actually estimate reach with confidence, and layer a phase gate on top so you stop running conversion tests on a funnel you can't measure.
Here's the full comparison, including where each model quietly breaks.
Why prioritization frameworks exist (and why most teams outgrow them)
Every growth team hits the same wall: the backlog has 47 ideas, the team can ship 3 per sprint, and the loudest person in the room decides what gets built. Scoring frameworks were invented to replace opinion with arithmetic.
They work — up to a point. Sean Ellis, who coined "growth hacking" and popularized ICE, has been explicit that the score's purpose is to force a conversation, not to produce a mathematically valid ranking. Intercom's Sean McBride and Sebastian Bensusan introduced RICE for exactly the same reason: to make trade-offs visible and arguments shorter.
The failure mode isn't the math. It's that all three models assume you already know which stage of growth work matters. They score individual ideas in isolation, with no view of whether your analytics are trustworthy, whether your funnel has a measurable bottleneck, or whether you're ready to pour money into paid acquisition. That's the gap.
ICE: fast, cheap, and appropriately crude
ICE scores each idea on three dimensions, typically 1–10, then averages or multiplies them.
Impact × Confidence × Ease (some teams use "Effort" inverted; same idea).
- Impact — how much will this move the metric if it works?
- Confidence — how sure are you it will work? (Evidence, not vibes.)
- Ease — how little effort will it take to ship?
Where ICE wins
ICE is the right tool when you have low traffic, no clean baseline data, and a small team. Scoring 20 ideas takes 30 minutes. You can do it live in a meeting. It biases toward cheap, fast tests — which is exactly what you want at seed stage when your real constraint is learning rate, not statistical rigor.
Where ICE breaks
Three predictable ways:
- Confidence inflation. Everyone rates their own idea an 8. Without a shared evidence rubric (e.g., "9 = we've seen this work on our own data; 5 = a competitor does it; 2 = a hunch"), Confidence becomes a popularity score.
- No reach dimension. A test that improves conversion 20% on a page 40 people visit per month scores identically to one on a page 40,000 people visit. This is ICE's single biggest flaw.
- Ease crowds out Impact. Multiply three numbers and the easiest ideas float to the top. Teams end up with a backlog of button-color tests and zero structural bets.
We've seen this last one repeatedly. A Series A SaaS client came to us with six months of ICE-scored experiments, 31 tests shipped, and a flat activation rate. Every test was a copy tweak because copy tweaks always score high on Ease.
PIE: the CRO-native model that hasn't aged well
PIE comes from WiderFunnel's Chris Goward and predates most modern growth stacks. It scores Potential, Importance, Ease.
- Potential — how much improvement is possible on this page? (Usually judged from analytics and heuristic UX review.)
- Importance — how valuable is the traffic hitting this page?
- Ease — how hard is it to implement the test, technically and politically?
Where PIE wins
PIE's "Importance" dimension is a rough proxy for traffic value, so it partly solves ICE's reach problem. And "Ease" explicitly includes political difficulty — whether legal, brand, or the CEO will block the test. That's an underrated variable that neither ICE nor RICE captures.
PIE is genuinely good for one job: prioritizing a list of pages or templates for A/B testing on a site with meaningful traffic.
Where PIE breaks
PIE is page-centric. It has no natural way to score an onboarding email sequence, a pricing model change, a lifecycle automation, a data-infrastructure fix, or a new acquisition channel. Modern growth work is mostly not page tests. If your backlog contains product changes, engineering work, and paid experiments alongside CRO, PIE forces awkward translation for two-thirds of your items.
It also has no time dimension. Nothing distinguishes a two-hour Optimizely change from a six-week rebuild.
RICE: the most defensible of the classic three
RICE adds a reach term and, crucially, divides by effort rather than multiplying by ease.
(Reach × Impact × Confidence) ÷ Effort
- Reach — number of people or events affected per time period. Use real numbers: 4,200 signups/quarter, not "7".
- Impact — a multiplier, typically 3 = massive, 2 = high, 1 = medium, 0.5 = low, 0.25 = minimal.
- Confidence — a percentage: 100% high, 80% medium, 50% low.
- Effort — person-months or person-weeks.
The output is "impact per unit of effort," which is a genuinely meaningful number — you're computing a rough ROI, not an average of three opinions.
Where RICE wins
RICE is the best default for teams past product-market fit with instrumented analytics. Because Reach uses absolute counts, RICE naturally kills the button-color tests that ICE loves. Because Effort is a denominator in real units, a six-week project must clear a much higher bar than a two-day one. And expressing Confidence as a percentage makes discipline easier to enforce: 50% means "we have a hypothesis," not "I feel okay about it."
Where RICE breaks
- It needs data you may not have. Reach estimates for genuinely new features or channels are guesses dressed in decimals. Precision theater.
- It's biased against compounding bets. A growth loop — referral mechanic, user-generated content engine, integration marketplace — has low immediate reach and high effort. RICE ranks it near the bottom, every time. Meanwhile the loop is the thing that would change your growth curve. This is RICE's structural blind spot, and it's why teams that follow RICE religiously often optimize themselves into a local maximum.
- Effort estimates are wrong. Software estimation error is well documented; there's no reason your growth backlog is immune. If Effort is off by 3x on half your items, your ranking is noise.
- It ignores learning value. A test that will teach you something decisive about your ICP scores the same as one that won't.
Head-to-head comparison
| Dimension | ICE | PIE | RICE | Growaton 4-Phase |
|---|---|---|---|---|
| Formula | I × C × E (or avg) | Avg of P, I, E | (R × I × C) ÷ E | Phase gate → then RICE-style score within phase |
| Accounts for reach | No | Partially (Importance) | Yes, in absolute numbers | Yes |
| Accounts for effort | Yes, as multiplier | Yes, as multiplier | Yes, as divisor in person-time | Yes, plus engineering dependency |
| Best for | Seed stage, low traffic, fast cycles | Landing-page and template CRO | Instrumented funnels, Series A+ | Teams with mixed product/eng/marketing backlogs |
| Data required | Minimal | Page-level analytics | Funnel-level analytics | Diagnostic audit first |
| Handles non-page work | Yes | Poorly | Yes | Yes |
| Handles compounding loops | No | No | No | Yes, via Scale phase |
| Handles data/infra work | No | No | No | Yes, via Measurement phase |
| Time to score 20 ideas | ~30 min | ~1 hr | ~2 hrs | ~2 hrs after initial diagnostic |
| Main failure mode | Confidence inflation, trivial tests | Page-only scope | Precision theater, kills big bets | Requires honest diagnostic |
Growaton's 4-Phase Prioritization: sequence before score
Here's the insight that reframed how we run growth backlogs across dozens of pods: the highest-scoring experiment in the wrong phase is worse than the lowest-scoring experiment in the right one.
Scoring models answer "which idea is best?" They never answer "is this even the kind of work we should be doing?" So our 4-Phase framework adds a gate before the score: Diagnostics → Measurement → Conversion → Scale.
Work is first assigned to a phase. You only score and rank within your current phase. Ideas from later phases sit in a parked backlog until their gate opens.
Phase 1 — Diagnostics
Question: Where is growth actually leaking?
This phase is not experiments. It's funnel forensics: cohort retention curves, activation-path analysis, channel-level unit economics, session replay on key flows, and customer interviews. The output is a ranked list of constraints, not a list of ideas.
Gate to exit: You can name your single biggest bottleneck with a number attached — "62% of signups never complete step 3 of onboarding, representing ~$480k of annual pipeline" — and you have at least three hypotheses for why.
Most teams skip this entirely and start scoring ideas on day one. That's how you get 31 copy tests and a flat activation rate.
Phase 2 — Measurement
Question: Can we trust what we'd measure?
Instrumentation, event taxonomy, attribution modeling, dashboard build, and test infrastructure. Unglamorous, unscoreable by ICE or RICE (Reach ≈ 0, Impact ≈ "enabling"), and the single highest-leverage work most seed-to-Series-B companies aren't doing.
Gate to exit: Every step of your core funnel fires a reliable event; you can segment by acquisition source; you can run an A/B test and get a trustworthy readout; and your revenue numbers in the warehouse reconcile with your billing system.
This is where classic frameworks fail most expensively. When we rebuilt attribution for a Series A SaaS company, that work would have scored near-zero in RICE — no direct reach, high effort, "medium" impact. It cut CAC 47%, because every paid dollar after it was allocated on real data instead of last-click fiction.
Phase 3 — Conversion
Question: What's the fastest path to more revenue from traffic and users we already have?
Now you run the experiment engine. Onboarding sequences, pricing and packaging tests, trial model changes, checkout flows, lifecycle messaging, in-product prompts, landing-page tests. This is where RICE-style scoring earns its keep, and where a high weekly shipping cadence compounds fastest — reliable readouts plus a real bottleneck plus volume of shots on goal.
Gate to exit: You've moved your primary bottleneck metric by a meaningful margin and your experiment win rate has stabilized enough to forecast. (Industry win rates for mature programs typically land in the 10–30% range — if you're at 60%, your tests are too timid or your stats are wrong.)
Phase 4 — Scale
Question: What compounds?
Growth loops, channel expansion, referral and virality mechanics, partner and integration ecosystems, content and SEO systems, expansion revenue and land-and-expand motions, AI-driven automation of the growth ops stack.
These are exactly the bets RICE structurally penalizes. Gating them into their own phase means they compete against each other rather than against a two-day copy test — which is the only way they ever get built.
Gate to enter: Phases 2 and 3 are healthy. Chasing loops on a leaky funnel with broken measurement is the most common way growth-stage startups burn a year.
Scoring inside a phase
Within your active phase, we score with a RICE variant that adds two terms the original omits:
(Reach × Impact × Confidence × Learning Value) ÷ (Effort × Dependency Risk)
- Learning Value (1–2×) — does this test resolve a decision that unblocks other work? A pricing test that tells you which segment to build for is worth more than its direct lift.
- Dependency Risk (1–2×) — does this require another team, a vendor, a legal review, or an unbuilt data pipeline? PIE's "political ease" instinct, quantified. In an embedded pod with product, engineering, data, and marketing in one team, this multiplier is usually 1 — which is precisely why integrated teams out-ship siloed ones on identical backlogs.
Same arithmetic spirit as RICE. Two corrections for the things that actually derail growth roadmaps in practice.
How to choose: a decision guide
Use ICE if:
- Under ~10,000 monthly visitors or ~1,000 monthly signups
- No reliable analytics yet (in which case: your real priority is Phase 2)
- Team of 1–3 running its first structured experiment program
- Add a written Confidence rubric on day one, and force at least one "hard, high-impact" item into every sprint to counter Ease bias
Use PIE if:
- Your growth scope is genuinely limited to site and landing-page CRO
- You're prioritizing pages or templates, not initiatives
- Otherwise, skip it — RICE does everything PIE does, plus more
Use RICE if:
- Instrumented funnel with trustworthy event data
- Backlog mixes product, engineering, and marketing work
- You need to defend prioritization to a board or exec team
- Reserve a fixed capacity slice (we suggest 20%) for high-effort compounding bets, or RICE will quietly starve them
Use a phase-gated model like 4-Phase if:
- You've shipped 20+ experiments with disappointing aggregate results
- Different disciplines are prioritizing against different implicit goals
- You suspect your measurement layer is unreliable but keep testing anyway
- Your backlog contains both "change this headline" and "build a referral engine" and you have no honest way to compare them
The pattern behind framework failure
After running this in dozens of pods, the diagnosis is almost never "wrong framework." It's one of four things:
- No agreed bottleneck. Scoring ideas without a named constraint means every score is measured against a different implicit goal.
- Untrustworthy measurement. If you can't read a result, prioritization is theater. This is the most common and most expensive failure.
- Effort estimates nobody revisits. Log actual effort against estimates for one quarter. Recalibrate. Most teams are off by 2–3x and never find out.
- Not enough shots on goal. At a 20% win rate, five tests per quarter yields one winner. Twenty yields four. Frameworks improve your hit rate; velocity determines your number of hits. Both matter, and velocity is usually the bigger lever — one reason we ship weekly rather than in quarterly waves.
Fix the sequencing and the measurement layer, and honestly, ICE will get you most of the way there. Skip them, and RICE's decimal places just make bad decisions look rigorous.
Bringing it together
| If your situation is... | Start with |
|---|---|
| Pre-PMF, tiny traffic, no analytics | Phase 2 work (measurement), then ICE |
| Post-PMF, clean data, mixed backlog | RICE + a reserved slice for compounding bets |
| CRO-only scope on a high-traffic site | PIE or RICE |
| 20+ tests shipped, flat results | Phase-gated model — you're likely testing in the wrong phase |
| Multiple teams, conflicting priorities | Phase gate to align on sequence, then score within phase |
The frameworks aren't competing religions. ICE is RICE with less data. PIE is RICE for pages. Our 4-Phase model is a sequencing layer that makes any of them work better by answering the prior question: what kind of work should we be doing right now?
If you've got a backlog you can't rank honestly — or a testing program that's shipping steadily and moving nothing — that's usually a phase problem, not a scoring problem. Book a free growth diagnostic and we'll walk your funnel, your data layer, and your backlog, and tell you which phase you're actually in. No scoring spreadsheet required.