Most failed growth programs don't fail because the team ran bad tests. They fail because nobody in the room agreed on what "significant," "lift," or "we won" actually meant. A founder hears "the test won by 30%," ships it, and three months later revenue hasn't moved. That gap is almost always a vocabulary problem before it's an execution problem.
This glossary defines the 65 terms that matter most in growth experimentation — organized by how you'd actually encounter them: strategy, test design, statistics, metrics, and operations. Each definition is short enough to skim and specific enough to use in a Monday standup. Where a term is routinely misused, we've added a founder note based on what we see running experiment programs inside seed-to-Series C companies at Growaton.
The 10 Terms Founders Get Wrong Most Often
If you read nothing else, read this. These are the misunderstandings that cost real money.
| Term | What founders think it means | What it actually means |
|---|---|---|
| Statistical significance | "The result is real and big" | The result is unlikely under the assumption of no effect — says nothing about size or business value |
| MDE | A prediction of the lift | The smallest effect your test is powered to detect; set it before launch |
| Lift | Absolute percentage points | Usually relative change (2% → 2.4% is a 20% relative lift, 0.4pp absolute) |
| Power | Something statisticians worry about | Your probability of finding a real effect; at 50% power you're coin-flipping |
| Win rate | Should be as high as possible | A 70% win rate usually means you're testing timid ideas or measuring wrong |
| Sample size | Total visitors | Visitors per variant who were actually exposed to the change |
| Guardrail metric | Nice-to-have | The metric that prevents you from shipping a "win" that destroys retention |
| Peeking | Being diligent | Checking results daily and stopping early — inflates false positives dramatically |
| A/B test | The only way to learn | One of eight or nine valid designs; often the wrong one for low-traffic products |
| Conversion rate | One number | Meaningless without a defined denominator, window, and unit of randomization |
Strategy and Program Terms
These define what you test and how fast. Most companies over-invest in statistics and under-invest here.
1. Growth experiment
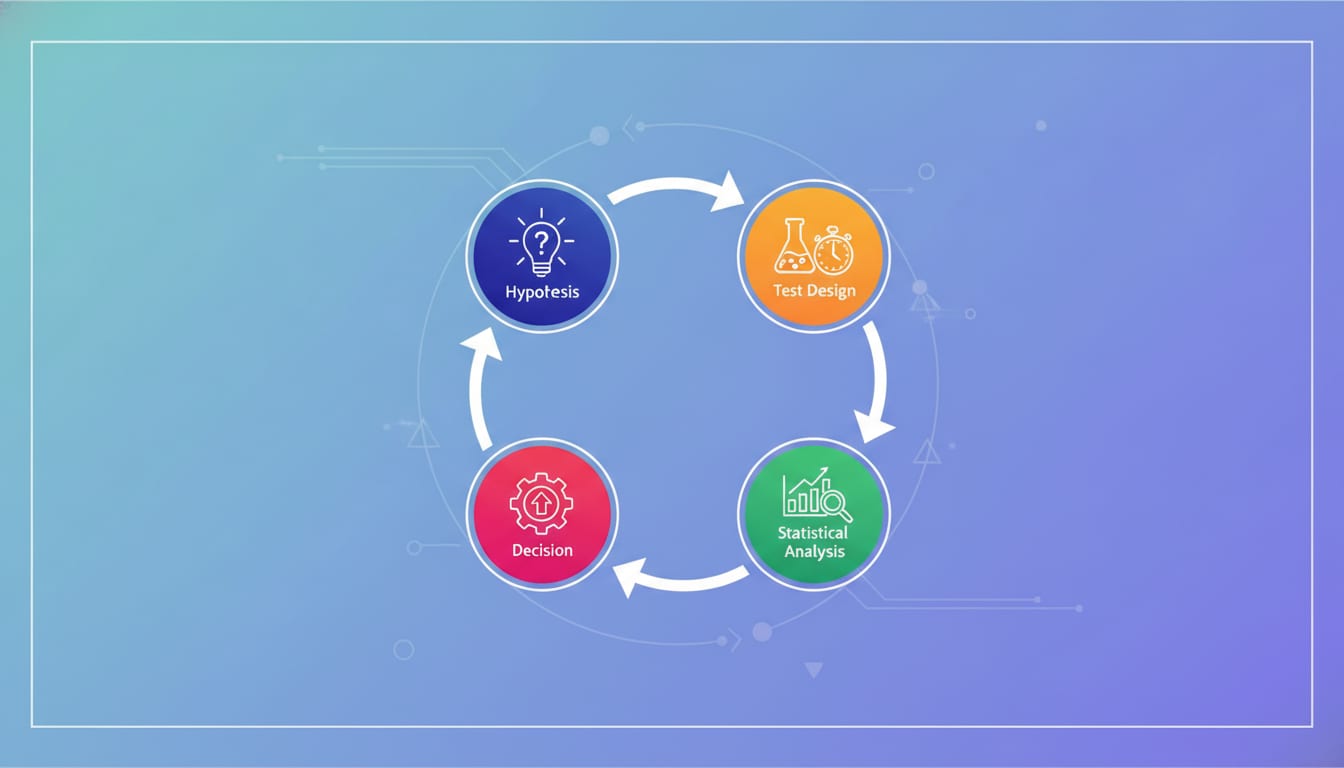
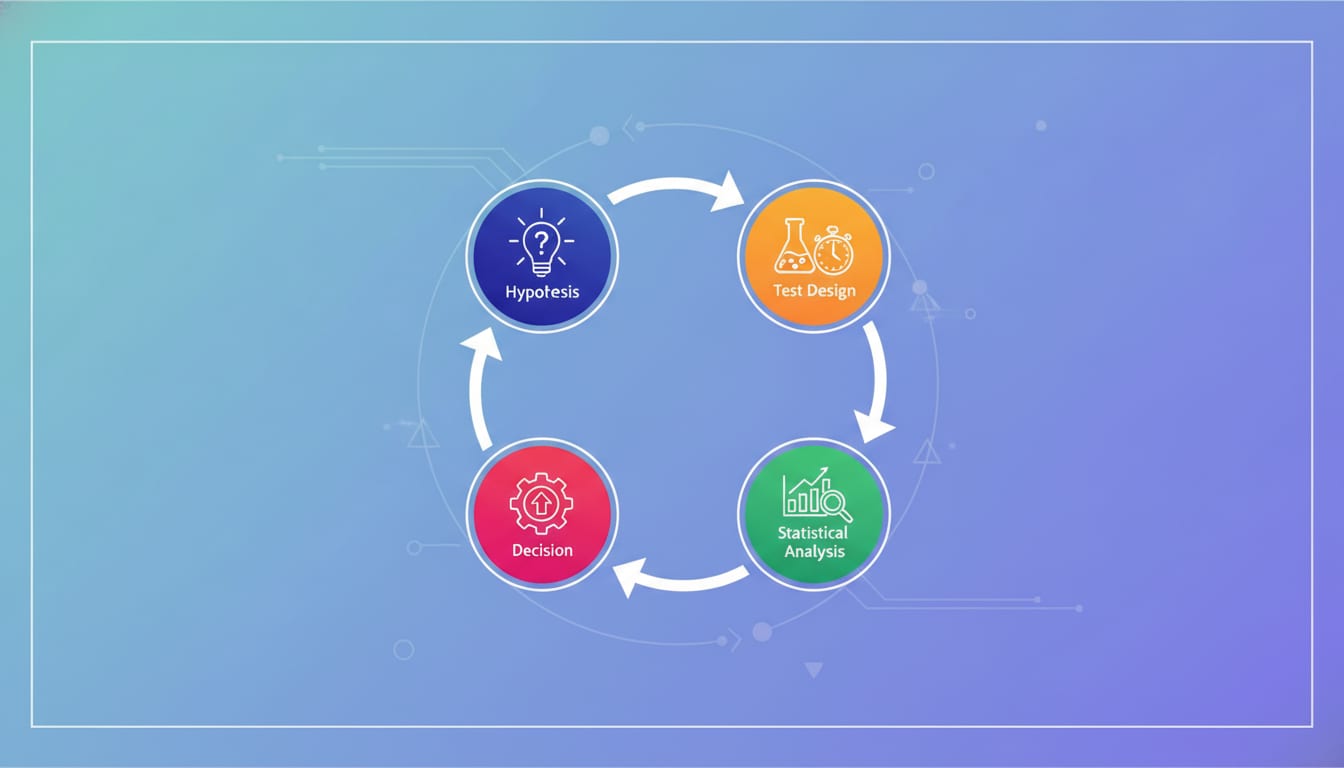
A deliberate, measurable change to a product, funnel, or channel, designed to test a specific belief about user behavior. A growth experiment has a hypothesis, a primary metric, a decision rule, and an owner. Anything missing one of those is a "change," not an experiment.
2. Growth hypothesis
A falsifiable statement in the form: Because [evidence], we believe that [change] will cause [metric] to move by [amount] for [segment]. We'll know we're right when [measurement].
Founder note: "We think a new hero image will improve conversion" is not a hypothesis. It has no evidence, no magnitude, and no segment. Weak hypotheses produce unlearnable results — you win or lose and still have no idea why.
3. Experiment backlog
The prioritized, written queue of hypotheses awaiting execution. A healthy backlog has 3–5x more ideas than your team can ship in a quarter and is scored consistently.
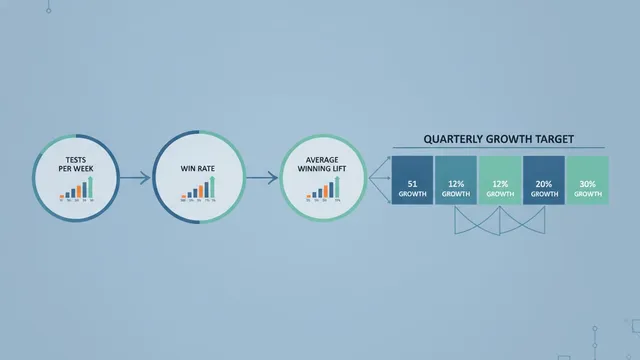
4. Experiment velocity
The number of valid experiments completed per unit of time (usually per month or per quarter). This is the single strongest predictor of growth program output, because learning compounds. A team running 8 tests a month with a 20% win rate produces more wins than a team running 2 tests a month at 40%.
5. Win rate
The share of experiments that produce a statistically and practically meaningful improvement. Industry-wide, credible programs land between 10% and 33% — Microsoft has publicly reported that only about a third of tested ideas improve the target metric, with another third neutral and a third actively harmful.
6. Learning rate
The share of experiments — wins and losses — that generate a documented, reusable insight. Growaton tracks this alongside win rate, because a losing test that invalidates a core assumption about your buyer is worth more than a 2% button-color win.
7. Growth model
A quantitative map of how your business creates revenue: inputs (traffic, signups, sales conversations), conversion rates between stages, and monetization. Your growth model tells you where a 10% improvement is worth $2M and where it's worth $40K.
8. Growth loop
A self-reinforcing system where the output of one cycle becomes the input to the next (a new user invites two more; content generates traffic that generates content). Unlike funnels, loops compound. See Growth Loops vs Funnels for the design patterns.
9. Funnel
A linear sequence of stages users pass through, each with a drop-off rate. Still the most useful diagnostic tool for finding where to test, even if loops are the better model for how growth compounds.
10. North Star Metric
The single metric that best captures the value your product delivers to customers and predicts long-term revenue (e.g., "weekly active teams with 3+ collaborators"). It exists to align teams, not to be the primary metric of every individual test.
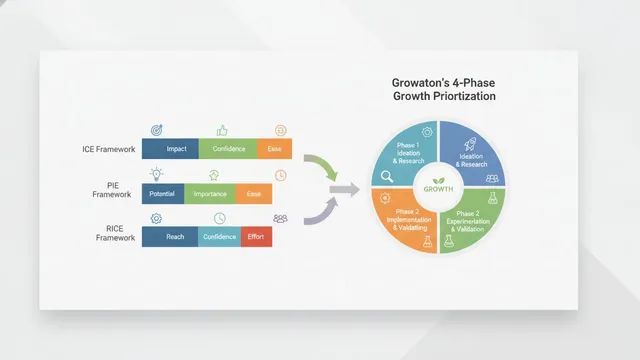
11. ICE score
Prioritization framework scoring each idea on Impact, Confidence, and Ease (1–10 each, averaged or multiplied). Fast and subjective — fine for early-stage teams, prone to scoring inflation once more than three people are involved.
12. RICE score
Reach × Impact × Confidence ÷ Effort. More rigorous than ICE because Reach forces you to quantify how many users actually hit the surface you're changing. Popularized by Intercom's product team.
13. PIE score
Potential, Importance, Ease — a CRO-oriented framework from WiderFunnel that biases toward page-level testing. Useful for e-commerce and landing page programs, weaker for product-led experiments.
Founder note: The scoring framework matters far less than scoring consistently and revisiting scores after results come in. We compare these approaches in depth in ICE vs PIE vs RICE vs Growaton's 4-Phase Prioritization.
Test Design Terms
How you construct the test determines whether the number at the end means anything.
14. A/B test (online controlled experiment)
An experiment where traffic is randomly split between a control and one or more variants, and outcomes are compared. Randomization is what buys you causality — without it you have a correlation, not a result.
15. A/A test
An experiment where both groups receive the identical experience. Used to validate that your testing infrastructure splits traffic evenly, tracks events correctly, and produces significant results at roughly the expected false-positive rate (5% at α=0.05). Growaton runs an A/A test before the first real test on every new client stack. It catches broken instrumentation about a third of the time.
16. Control and variant
The control is the existing experience (often labeled A or "baseline"). A variant (B, C, …) is any modified experience. Everything is measured relative to control.
17. Multivariate test (MVT)
A design that tests multiple elements simultaneously and measures both individual and interaction effects (e.g., 3 headlines × 2 images = 6 combinations). Requires dramatically more traffic than an A/B test. Rarely appropriate below ~100K monthly visitors on the tested surface.
18. Split URL test
A variant hosted on a separate URL, with traffic redirected. Used when the variant is a full redesign rather than a component change. Watch for redirect latency skewing results.
19. Randomization unit
The entity you randomize on: visitor, user account, session, device, company/workspace, or geography. This is the most consequential design decision most teams make by accident. If your product is collaborative (B2B SaaS, marketplaces), randomizing by user instead of by account leaks treatment across the boundary and biases your result toward zero.
20. Holdout group
A slice of users (typically 5–10%) deliberately excluded from all shipped changes over a longer horizon, used to measure the cumulative impact of a quarter or year of experimentation. The antidote to "we shipped 40 wins but revenue is flat."
21. Feature flag
A code-level toggle that controls which users see which experience, without redeploying. The infrastructure backbone of product experimentation, and the reason engineering must be in the pod rather than adjacent to it.
22. Painted door test (fake door / smoke test)
Exposing an entry point for a feature that doesn't exist yet — a button, pricing tier, or nav item — and measuring click intent before building. The cheapest way to kill a bad roadmap item. Always follow with an honest "coming soon" state to avoid burning trust.
23. Switchback test
Time-based randomization where the entire system alternates between control and treatment in fixed intervals. Essential in marketplaces and logistics, where user-level randomization breaks down because supply and demand interact (a treatment that gets one rider a faster car takes that car away from a control rider).
24. Quasi-experiment
A causal-inference method used when randomization isn't possible: difference-in-differences, regression discontinuity, synthetic control, or matched cohorts. Weaker than an RCT, far better than a before/after chart.
25. Geo-lift test
Randomizing at the geographic level (DMAs, cities, countries) to measure incrementality of channels that can't be cookie-tracked — TV, out-of-home, and increasingly paid social under privacy restrictions. Meta's open-source GeoLift library is the common starting point.
26. Ramp (phased rollout)
Gradually increasing traffic allocation to a variant — 1% → 5% → 20% → 50% — to catch catastrophic bugs and performance regressions before full exposure. Ramping is a safety mechanism, not a statistical one; the analysis window starts when allocation stabilizes.
Statistics Terms
You don't need a stats degree. You need to not get fooled. These are the terms that separate defensible decisions from expensive guesses.
27. MDE (Minimum Detectable Effect)
The smallest effect size your test is designed to detect reliably, given your baseline rate, sample size, significance level, and power. You choose MDE before launch; it determines how long the test must run.
The critical insight: smaller MDEs require quadratically more traffic. Halving your MDE roughly quadruples your required sample.
| Baseline conversion | Target relative lift (MDE) | Approx. sample per variant* |
|---|---|---|
| 2% | 20% | ~19,600 |
| 5% | 20% | ~7,600 |
| 5% | 10% | ~30,400 |
| 5% | 5% | ~121,600 |
| 20% | 10% | ~6,400 |
| 20% | 5% | ~25,600 |
| 40% | 10% | ~2,400 |
*Two-sided test, 95% confidence, 80% power, using the standard 16·p(1−p)/δ² approximation. Verify with a proper calculator such as Evan Miller's.
Founder note: If your checkout gets 4,000 visitors a month at a 3% conversion rate, you cannot detect a 5% lift. Ever. Accept it and go test bigger swings, higher-traffic surfaces, or use a different design. Our Experiment Velocity Calculator exists to make this constraint visible before you waste a quarter.
28. Statistical significance
A result is statistically significant when the observed difference is unlikely to have occurred if there were truly no effect. It is a statement about evidence against the null hypothesis, not about the size, durability, or business value of the effect.
29. p-value
The probability of observing a result at least as extreme as yours, assuming the null hypothesis (no difference) is true. p = 0.03 does not mean "97% chance the variant is better." That misreading is the single most common statistical error in growth teams.
30. Significance level (alpha)
The p-value threshold at which you'll declare significance — conventionally 0.05. Alpha is your tolerance for false positives. Lower it for irreversible or high-risk decisions; raising it above 0.10 makes results near-worthless.
31. Confidence interval
The range of effect sizes compatible with your data at a given confidence level. Far more useful than a p-value for decision-making: a "significant" win with a 95% CI of [+0.4%, +19%] tells you the true effect might be trivial. Always ask for the interval, not just the verdict.
32. Statistical power (1 − beta)
The probability your test detects a real effect of the specified size. Standard is 80%; meaning even with a genuine effect, you'll miss it one time in five. Underpowered tests are the reason teams conclude "nothing works."
33. Sample size
The number of exposed users per variant required to hit your MDE at your chosen alpha and power. Exposed means they actually reached the surface being tested — not total site traffic.
34. Type I error (false positive)
Concluding a variant works when it doesn't. You ship something useless and it becomes permanent technical debt.
35. Type II error (false negative)
Concluding a variant doesn't work when it does. You kill a genuinely good idea and, worse, add it to your "we tried that" folklore.
36. Peeking
Repeatedly checking results and stopping the moment significance appears. With daily peeking over a two-week test, your effective false-positive rate can climb well above 30% instead of 5%. This is the most damaging habit in growth teams, and it's contagious the moment a founder gets dashboard access. Evan Miller's explanation remains the canonical read.
37. Sequential testing
Statistical methods (always-valid p-values, group sequential designs, mSPRT) explicitly designed to allow continuous monitoring without inflating false positives. If your team can't resist looking, adopt sequential methods rather than pretending you won't peek. Airbnb, Optimizely, and Netflix all run variations of this approach.
38. Bayesian A/B testing
An alternative framework that reports the probability that a variant beats control, and expected loss from choosing wrong, rather than p-values. More intuitive for business decisions and doesn't require fixed sample sizes, but it's sensitive to prior selection and isn't a free pass to stop whenever you like.
39. Probability to beat baseline (chance to win)
The Bayesian output most tools surface: "Variant B has an 87% probability of being better than A." Interpretable at face value — unlike a p-value — but pair it with expected loss before shipping.
40. Practical significance
Whether the effect is large enough to matter to the business. A statistically significant 0.3% lift on a page that touches 2% of revenue is not worth the engineering cost of maintaining it. Define your practical threshold in the experiment brief.
41. Sample Ratio Mismatch (SRM)
When observed traffic split deviates significantly from intended (e.g., you set 50/50 and got 52/48 across 200K users). SRM signals a broken randomization, bot filtering, or logging bug — and invalidates the result. Microsoft's experimentation team documented that a meaningful share of experiments fail this diagnostic. Run an SRM check on every test, automatically.
42. Multiple comparisons problem
Testing many metrics or many variants simultaneously inflates the chance at least one looks significant by luck. Testing 20 metrics at α=0.05 gives you roughly a 64% chance of at least one false positive. Fix with a pre-declared primary metric, or corrections like Bonferroni or Benjamini–Hochberg false discovery rate control.
43. Novelty effect and primacy effect
Novelty effect: existing users engage with something simply because it's new, inflating early results that decay. Primacy effect: the opposite — users perform worse initially because the change disrupts a learned habit. Both argue for running tests through at least one full weekly business cycle, and for checking whether the effect holds in the second week.
44. Simpson's paradox
When a trend appears in aggregate but reverses within every subgroup — usually caused by uneven traffic allocation across segments during ramping. Guard against it by segmenting results by device, channel, and new/returning after the test concludes.
45. CUPED (variance reduction)
Controlled-experiment Using Pre-Experiment Data: a technique that uses each user's pre-test behavior to reduce metric variance, cutting required sample size by 20–50% on retention-heavy metrics. Originated at Microsoft (paper) and now standard in mature platforms. The most under-used lever available to low-traffic startups.
46. Interaction effect
When two concurrent experiments influence each other's results. Mostly a non-issue at startup scale if experiments touch different surfaces; becomes real when two tests modify the same flow. Maintain a live experiment map.
47. Regression to the mean
The tendency of extreme early results to drift toward the average as the sample grows. It's why the variant that's "+40%" on day two is +3% on day fourteen — and why day-two decisions are expensive.
Metric Terms
48. Primary metric (OEC)
The single metric that decides the experiment, sometimes called the Overall Evaluation Criterion. Declared before launch. One per experiment. Non-negotiable.
49. Secondary metrics
Metrics you monitor for context and explanation but don't use to declare a winner. Useful for building the narrative of why a test moved the primary metric.
50. Guardrail metrics
Metrics that must not degrade regardless of the primary result — page load time, error rate, refund rate, support ticket volume, D30 retention, unsubscribe rate. A checkout test that lifts conversion 12% and refunds 20% is a loss.
51. Proxy metric
A fast-moving stand-in for a slow-moving outcome (e.g., "invited a teammate in week one" as a proxy for 12-month retention). Necessary because you can't run 12-month tests — dangerous when the proxy correlation was never validated.
52. Leading vs. lagging indicator
Leading indicators move first and predict outcomes (activation rate, trial-to-paid velocity). Lagging indicators confirm results after the fact (MRR, churn, LTV). Experiments target leading indicators; boards track lagging ones.
53. Activation rate
The percentage of new users who reach the moment of demonstrated value within a defined window. The definition must be specific and behavioral — "created a project and invited one collaborator within 7 days," not "logged in." See Activation Rate Benchmarks by SaaS Vertical for comparison data.
54. Conversion rate
Conversions ÷ eligible population, over a defined window, at a defined randomization unit. Every one of those qualifiers must be written down or two people will compute two different numbers.
55. Absolute vs. relative lift
Absolute lift is the difference in percentage points (2.0% → 2.4% = +0.4pp). Relative lift is the proportional change (+20%). Tools report relative by default; finance models expect absolute. Mixing them is how a "30% win" becomes a $0 revenue impact in the board deck.
56. Cohort
A group of users sharing a common start characteristic — usually signup week or month. Cohort analysis separates "our product got better" from "we acquired more users."
57. Retention curve
Percentage of a cohort still active at day/week N. A curve that flattens indicates product-market fit within that segment; a curve that trends to zero means no experiment on the acquisition side will save you.
58. Triggered analysis
Restricting analysis to users who actually encountered the tested element. If only 8% of visitors reach the surface you changed, analyzing all visitors dilutes a real effect into statistical noise. Triggering is often the difference between a "flat" test and a clear win.
59. Heterogeneous treatment effects (segment analysis)
The reality that one variant can help new users and hurt power users simultaneously. Explore segments after the primary read, treat findings as hypotheses for the next test — not as ship-ready conclusions.
60. Incrementality
The portion of a result that would not have happened anyway. Central to paid media evaluation: a retargeting campaign showing 8x ROAS in-platform may have near-zero incremental revenue. Measured with holdouts and geo-lift, not attribution tags.
Operations and AI-Era Terms
61. Experiment brief (pre-registration)
A one-page document written before launch: hypothesis, primary metric, guardrails, randomization unit, MDE, required sample, planned duration, and decision rules for win/loss/inconclusive. Pre-registration is the cheapest safeguard against motivated reasoning that exists.
62. Kill criteria
Pre-agreed conditions that stop a test immediately — a guardrail breach, an error-rate spike, an SRM alert. Defined in advance so the decision isn't made emotionally at 11pm.
63. Experiment repository
A searchable, permanent record of every test: hypothesis, design, result, effect size, confidence interval, and the decision made. Companies that keep one stop re-running the same test every 18 months as team members turn over. Companies that don't pay for the same learning three times.
64. Multi-armed bandit
An algorithm that dynamically shifts traffic toward better-performing variants during the test, maximizing reward instead of maximizing learning. Excellent for time-boxed decisions (promo creative, headline selection); poor when you need a clean, unbiased effect estimate or when the metric has a long lag.
65. Contextual bandit / algorithmic personalization
A bandit that selects variants based on user attributes — serving different experiences to enterprise vs. self-serve visitors. Powerful, but it hides why something works and demands far more data than most Series A companies have.
66. LLM-assisted variant generation
Using large language models to produce test variants — copy, subject lines, landing page angles — at volume. The real constraint has moved from generating ideas to validating them; a team that can produce 50 variants but only has traffic for 4 tests a month hasn't gained anything. We break down what actually pays back in Manual Growth Ops vs AI-Augmented Growth: The Real Numbers.
67. Growth pod
A cross-functional unit — growth engineering, data, design, and marketing — with shared ownership of a metric and the authority to ship. The structural alternative to routing every experiment through four separate vendors and a JIRA queue. It's how we're built, because experiment velocity dies at handoff boundaries.
How to Actually Use This Vocabulary
Definitions are cheap. Here's the operating discipline that makes them worth something, drawn from running experiment programs inside dozens of seed-to-Series C companies:
- Write the brief before you write the code. Hypothesis, primary metric, MDE, sample, guardrails, decision rules. Fifteen minutes. It kills roughly a quarter of ideas outright, which is the point.
- Compute your MDE honestly and design to your traffic. If your surface can only detect 20% relative lifts, stop testing 5% ideas and go find bigger swings — pricing, onboarding sequence, positioning, channel.
- Ban mid-test decisions or adopt sequential methods. Pick one. Don't pretend you can peek responsibly.
- Report confidence intervals and absolute lift alongside relative lift. Every time.
- Log every result, including the boring ones. Your repository is the compounding asset, not any individual win.
- Measure learning rate, not just win rate. A program at a 15% win rate and 90% learning rate beats a 40% win rate with no documentation.
The teams that compound aren't the ones with the fanciest statistics. They're the ones who run more well-designed tests per quarter than everyone else and remember what happened.
If you want an outside read on where your experimentation program is leaking — instrumentation gaps, traffic constraints, prioritization drift, or a backlog full of 1% ideas — that's exactly what our free growth diagnostic covers. And if you'd rather see the mechanics first, our 4-phase methodology and case study library walk through how these terms translate into shipped results on a weekly cadence.