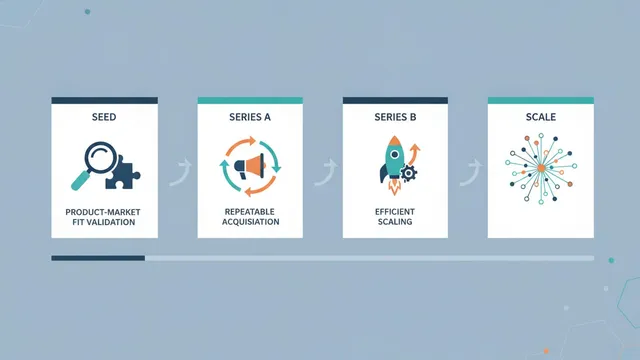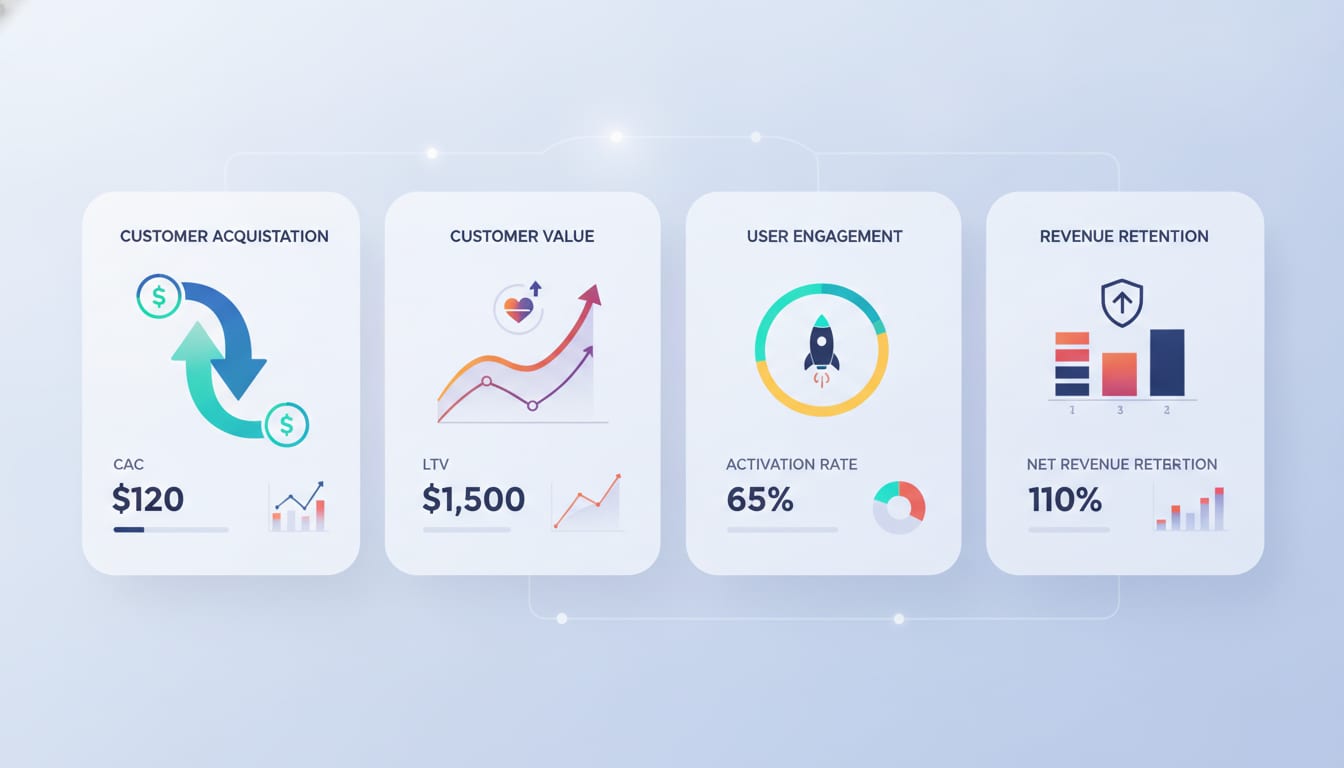
Short answer: Startup scaling vocabulary breaks into six clusters — unit economics, acquisition, activation and retention, experimentation, revenue operations, and organizational scaling. If you can define CAC payback, activation rate, net revenue retention, ICE scoring, and pipeline velocity — and you know what "good" looks like for your stage — you can run most board conversations and most growth reviews without a translator.
We wrote this glossary because of a pattern we keep seeing at Growaton. A founder tells us their CAC is $400. We ask whether that's blended or paid-only, whether it includes salaries, and whether it's fully loaded with agency fees. Three different answers come back from three people on the same team. The problem isn't the metric — it's that nobody agreed on the definition before they started reporting it.
Vocabulary precision is a growth lever. Teams that define terms the same way run faster experiments, argue less in reviews, and catch bad numbers earlier. Below are the 50 terms that actually come up in seed-through-Series-C operating meetings, grouped by function, with the definitions we use in client engagements — plus the traps that make each one easy to get wrong.
Part 1: Unit Economics & Financial Health (Terms 1–12)
These are the numbers investors underwrite and the numbers that determine whether growth is compounding or just expensive.
1. CAC (Customer Acquisition Cost)
Total sales and marketing spend divided by new customers acquired in the same period. The critical distinction is blended CAC (all spend ÷ all new customers, including organic) versus paid CAC (paid spend ÷ paid-attributed customers). Blended CAC flatters you when word-of-mouth is strong; paid CAC tells you what growth actually costs at the margin. Report both.
2. Fully Loaded CAC
CAC including salaries, tooling, contractor and agency fees — not just ad spend. Most founders quoting a "$300 CAC" are quoting media spend only. Fully loaded is typically 1.8–3x higher. Investors will do this math for you during diligence, so do it first.
3. LTV (Lifetime Value)
Gross-margin-adjusted revenue expected from a customer over their lifetime. The clean formula: (ARPA × Gross Margin %) ÷ Churn Rate. If you're using revenue instead of gross profit, you're inflating LTV by whatever your COGS is — often 20–30% in SaaS, far more in e-commerce.
4. LTV:CAC Ratio
The efficiency ratio investors anchor on. 3:1 is the conventional benchmark. Below 1:1 you're burning money on every customer. Above 5:1 you're likely under-investing in growth and leaving market share on the table. The ratio is meaningless without a payback period alongside it — a 4:1 LTV:CAC with a 30-month payback still starves cash flow.
5. CAC Payback Period
Months to recover fully loaded CAC from gross profit. CAC ÷ (ARPA × Gross Margin %). For SMB SaaS, under 12 months is healthy. Mid-market, 12–18. Enterprise, 18–24 can be acceptable if net retention is strong. Payback period is the metric we watch most closely in early diagnostics because it determines how fast you can redeploy capital.
6. Gross Margin
Revenue minus cost of goods sold, as a percentage. Software COGS includes hosting, third-party APIs, payment processing, and customer support. Median SaaS gross margin sits in the 70–80% range; marketplaces and fintech run lower depending on take rate structure.
7. Burn Multiple
Net burn ÷ net new ARR. Popularized by David Sacks at Craft Ventures, it answers "how much are we burning to generate a dollar of new recurring revenue?" Under 1x is exceptional, 1–1.5x great, 1.5–2x good, above 3x is a problem.
8. Rule of 40
YoY growth rate % + profit margin % should exceed 40. A company growing 80% with a -35% margin scores 45 and passes. A company growing 15% at 10% margin scores 25 and doesn't. Increasingly the default screen for growth-stage rounds.
9. Net Burn / Runway
Net burn is cash out minus cash in per month. Runway is cash on hand ÷ net burn. The founder version of this that matters: runway at current burn versus runway at planned burn. Those diverge fast when you're hiring.
10. ARR / MRR
Annual and monthly recurring revenue. Only genuinely recurring, contracted revenue counts. Professional services, one-time implementation fees, and usage overages that don't repeat are not ARR — mixing them in is one of the fastest ways to lose credibility in diligence.
11. ARPA / ARPU
Average revenue per account (or user). Rising ARPA with flat customer count means expansion is working. Falling ARPA with rising counts often means you're drifting downmarket without repricing.
12. Contribution Margin
Revenue minus all variable costs, including CAC, for a cohort. This is the number that tells you whether a specific channel or segment is actually profitable — critical for e-commerce and marketplaces where blended P&L hides losers.
| Metric | Seed | Series A | Series B–C |
|---|---|---|---|
| LTV:CAC | Directional only | 3:1 | 3:1+ and stable |
| CAC payback | <18 mo | <12–15 mo | <12 mo |
| Gross margin | 60%+ | 70%+ | 75%+ |
| Burn multiple | <3x | <2x | <1.5x |
| NRR (SaaS) | N/A | 100%+ | 110%+ |
Directional ranges we use in diagnostics; benchmarks vary meaningfully by vertical and ACV.
Part 2: Acquisition & Demand Generation (Terms 13–22)
13. Channel-Market Fit
The state where a specific acquisition channel reliably produces customers at acceptable CAC and volume. Product-market fit doesn't guarantee it. Most startups find exactly one or two channels that work — Brian Balfour's work on the four fits remains the sharpest treatment of why.
14. Blended vs. Incremental Lift
Incremental lift is the additional conversion caused by a channel, measured against a holdout or geo-split. Blended attribution routinely credits paid search with conversions that would have happened anyway. If you've never run a spend-pause test, you don't know your incremental CAC.
15. MQL / SQL / PQL
Marketing Qualified Lead (fits ICP and showed intent), Sales Qualified Lead (sales accepted it), Product Qualified Lead (took meaningful in-product actions signaling buying intent). PQLs convert at multiples of MQLs in product-led motions — usually 3–5x in the accounts we've instrumented.
16. ICP (Ideal Customer Profile)
The firmographic and behavioral definition of the accounts you win, retain, and expand best. A real ICP is exclusionary. If your ICP doesn't disqualify at least half your inbound, it isn't a profile — it's a wish.
17. TAM / SAM / SOM
Total addressable, serviceable addressable, and serviceable obtainable market. Bottom-up TAM (accounts × realistic ACV) beats top-down (analyst report × arbitrary percentage) in every investor conversation we've observed.
18. Pipeline Coverage
Open pipeline ÷ quota or revenue target. 3x is the common rule for a quarter. Below 2.5x, the quarter is usually already lost.
19. Pipeline Velocity
(Opportunities × Win Rate × Average Deal Size) ÷ Sales Cycle Length. The single most useful sales-side formula because it shows exactly which of four levers to pull. Shortening cycle length is usually the cheapest.
20. Attribution Model
The logic assigning credit across touchpoints: first-touch, last-touch, linear, time-decay, or data-driven. All are wrong in different directions. Use one consistently for trend analysis and use holdout tests for truth.
21. Marketing Efficiency Ratio (MER)
Total revenue ÷ total marketing spend. Popular in e-commerce because it sidesteps post-iOS-14 attribution noise entirely. A 4.0 MER means $4 of revenue per $1 of marketing.
22. Share of Search
Your branded search volume as a percentage of category search volume. A leading indicator of market share that moves 6–12 months ahead of revenue — and one of the few brand metrics with real predictive evidence behind it.
Part 3: Activation, Retention & Product-Led Growth (Terms 23–33)
23. Activation Rate
The percentage of new signups reaching a defined value milestone within a set window. Meaningless without specifying both. "40% activation" answers nothing; "40% of signups invite a teammate within 7 days" is actionable. Activation is where we find the largest untapped conversion gains in most PLG audits — bigger than anything available at the top of the funnel.
24. Aha Moment
The specific in-product action correlated with long-term retention. Found by regressing retained-user behavior against churned-user behavior in the first session or week, not by guessing in a whiteboard session.
25. Time to Value (TTV)
Elapsed time from signup to first meaningful outcome. Cutting TTV is usually the highest-leverage activation work available, and it's often an engineering problem — pre-filled data, templates, integrations — rather than a copywriting one.
26. Onboarding Completion Rate
Percentage finishing the guided setup flow. Track it step-by-step, not in aggregate. The drop-off is almost always concentrated in one or two steps, and it's usually a required field nobody needed.
27. Logo Churn vs. Revenue Churn
Logo churn counts customers lost. Revenue churn counts dollars lost. Losing many small accounts and few large ones produces terrifying logo churn and healthy revenue churn — or the reverse, which is far more dangerous.
28. Net Revenue Retention (NRR)
(Starting ARR + Expansion − Contraction − Churn) ÷ Starting ARR. Above 100% means the existing base grows without new sales. Best-in-class SaaS sits at 120%+. NRR compounds harder than any acquisition channel; it's the closest thing to a cheat code in recurring revenue.
29. Gross Revenue Retention (GRR)
Same calculation excluding expansion. Caps at 100%. GRR is the honest measure of whether customers stay — NRR can mask serious churn behind a few large upsells.
30. Cohort Analysis
Grouping users by signup period and tracking behavior over time. The only reliable way to distinguish real product improvement from growth-driven mix shifts. If your retention curve flattens rather than descending to zero, you have a durable product.
31. Expansion Revenue
Additional revenue from existing customers via seats, usage, or upgrades. In mature PLG companies, expansion frequently exceeds new-logo revenue.
32. Product-Led Growth (PLG)
A go-to-market model where the product drives acquisition, activation, and expansion — free trial, freemium, or self-serve. PLG is not "no sales team." It's sales triggered by product signals rather than form fills.
33. Freemium vs. Free Trial
Freemium offers an indefinitely free tier; free trial offers time-boxed full access. Freemium suits high-volume, low-ACV, viral products. Free trial suits higher-consideration purchases where value is demonstrable in 14–30 days. Choosing wrong is expensive and hard to reverse.
Part 4: Experimentation & Growth Engineering (Terms 34–41)
34. Growth Experiment
A structured test with a hypothesis, a primary metric, a defined sample, and a pre-committed decision rule. If you can't state what result would make you kill the idea, you're not running an experiment — you're shipping and hoping.
35. Experiment Velocity
Number of valid experiments completed per unit time. The strongest predictor of compounding growth we track, and the core reason we ship weekly rather than in quarterly campaigns. Ten experiments at a 20% win rate beats two experiments at 50%.
36. ICE / RICE Scoring
Prioritization frameworks. ICE = Impact × Confidence × Ease. RICE = (Reach × Impact × Confidence) ÷ Effort. Both are deliberately crude. Their value is forcing explicit assumptions, not producing precise rankings.
37. Statistical Significance & p-value
The probability your observed result occurred by chance. The 95% confidence threshold (p < 0.05) is convention, not law. For low-risk UI changes, 85–90% confidence plus a directional read is often a rational business decision.
38. Minimum Detectable Effect (MDE)
The smallest lift your test can reliably detect at your traffic level. Run the calculation before the test. Most early-stage A/B tests are underpowered — teams chase 3% lifts on traffic that can only detect 20%, then act on noise.
39. Novelty Effect
Temporary performance lift from change itself rather than change quality. Guard against it by running tests through at least one full business cycle — typically two weeks.
40. Holdout Group
A segment deliberately excluded from a treatment to measure true incremental impact. Underused, and the cleanest way to validate channel or lifecycle-program value.
41. Feature Flag
A deployment mechanism to enable or disable functionality for defined user segments without a release. The infrastructure that makes weekly experiment cadence possible — and the reason growth work benefits from engineers embedded in the pod rather than a ticket queue.
Part 5: Revenue Operations & Data (Terms 42–46)
42. Source of Truth
The single authoritative system for a given metric. Without one designated per metric, finance, marketing, and product will each present different revenue numbers in the same meeting. Fixing this is unglamorous and consistently one of the highest-ROI first projects in an engagement.
43. Event Taxonomy
The standardized naming and property schema for product analytics events. Retrofitting a taxonomy after 18 months of ad-hoc tracking costs 5–10x what defining it upfront does.
44. Reverse ETL
Piping data from the warehouse back into operational tools — CRM, email, ad platforms. Enables things like syncing PQL scores directly to sales sequences.
45. Lead-to-Account Matching
Associating inbound leads with existing CRM accounts. Broken matching creates duplicate outreach, misattributed pipeline, and unhappy customers who get prospected by their own vendor.
46. Data Latency
The lag between an event occurring and its availability for decisions. Weekly experiment cadence requires daily-or-better latency. If your dashboard refreshes monthly, you're running quarterly growth regardless of intent.
Part 6: Team & Organizational Scaling (Terms 47–50)
47. Span of Control
Direct reports per manager. Beyond 7–8, coaching quality degrades measurably. Watch this during rapid hiring — it silently breaks before anything visible does.
48. Embedded Pod
A cross-functional team — product, engineering, data, marketing — operating as a single unit with shared outcome ownership rather than functional handoffs. It's the structure we're built around at Growaton, because growth bottlenecks rarely respect departmental boundaries: your conversion problem is an engineering problem is a data problem.
49. Operating Cadence
The fixed rhythm of planning, review, and decision-making — daily standups, weekly experiment reviews, monthly metric reviews, quarterly planning. Cadence beats intensity. A team shipping one validated learning weekly outperforms one doing quarterly heroics, every time.
50. DRI (Directly Responsible Individual)
One named person accountable for an outcome. Not a committee. The failure mode in scaling teams isn't lack of effort — it's diffusion of ownership across three people who each assumed someone else had it.
How to Actually Use This Glossary
Definitions are table stakes. The work is in the operating discipline around them:
Write your definitions down. One page, shared, versioned. Specify whether CAC is blended or paid, whether LTV uses gross margin, what window activation measures. Most metric disputes are definitional, not analytical.
Pick 5–7 metrics per stage, not 30. Seed: activation rate, weekly retention, qualitative signal. Series A: CAC payback, NRR, experiment velocity. Series B+: burn multiple, Rule of 40, contribution margin by segment. Everything else is a supporting diagnostic.
Instrument before you optimize. You cannot improve activation without an event taxonomy, and you cannot trust an A/B test result without an MDE calculation. Measurement is phase two of our 4-phase framework for exactly this reason — diagnostics first, then measurement, then conversion, then scale. Skipping to conversion work on broken data is the most common expensive mistake we're brought in to fix.
Benchmark against your stage and vertical, not against TechCrunch. A fintech with 45% gross margins isn't failing; it has different economics than horizontal SaaS. Compare to peers at your ARR band and business model.
Where Most Teams Go Wrong
Three patterns show up repeatedly in diagnostics:
Vanity precision. Reporting LTV to two decimals on a 14-month-old company with 60 customers and no meaningful churn data. Early-stage LTV is an estimate with enormous error bars — treat it that way and focus on payback period instead, which is measurable.
Metric theater. Dashboards nobody uses to make decisions. If a number hasn't changed a decision in two quarters, delete it. Every metric you track has a maintenance cost.
Definition drift. Activation gets redefined mid-quarter to look better. Churn quietly starts excluding "paused" accounts. This is how teams lie to themselves without anyone intending to. Lock definitions, version changes, and annotate the dashboards when they change.
The founders who scale cleanly aren't the ones with the most sophisticated metrics. They're the ones whose whole team means the same thing by the same words, reviews the same numbers on the same cadence, and acts on them fast. Vocabulary is infrastructure.
If you want a second read on which of these numbers actually matter for your stage — and where your data is quietly lying to you — that's precisely what we do in a free growth diagnostic. No deck, just a look at your funnel and your unit economics.