The short answer: most startups that feel ready to scale aren't. Scaling readiness isn't about ambition, headcount, or the size of your last round — it's about whether you have four things in place at once: a repeatable acquisition channel, a retention curve that flattens, unit economics that survive contact with paid spend, and an operating system that can absorb 3x more experiments without breaking. Miss one, and scaling doesn't accelerate growth — it accelerates burn.
Below is a 25-question diagnostic we've adapted from the discovery process we run with seed-to-Series C companies at Growaton. Score it honestly, in one sitting, with your actual dashboards open. Then read the interpretation section that matches your score.

Why "Are We Ready to Scale?" Is the Wrong Question to Guess At
Premature scaling is the single most documented cause of startup failure. The Startup Genome Project's analysis of thousands of startups found that companies that scale prematurely — hiring ahead of proven demand, spending ahead of proven unit economics — grow slower and fail more often than their disciplined peers (Startup Genome, The Startup Genome Report Extra on Premature Scaling). CB Insights' post-mortem analysis of failed startups consistently lists "ran out of cash" and "no market need" as the top two causes (CB Insights, The Top 12 Reasons Startups Fail) — both of which are downstream symptoms of scaling before the fundamentals hold.
The pattern we see repeatedly in diagnostics: a company raises a Series A, triples the go-to-market team, quadruples paid spend, and discovers six months later that the channel that produced the first $1M ARR does not produce the second $3M. The channel wasn't broken. It was never repeatable — it was a founder with a network, or one lucky content asset, or a partnership that had a ceiling nobody measured.
Readiness is measurable. That's the whole point of this quiz.
How to Take the Quiz
- 25 questions, 5 sections. Each question is worth 0, 1, or 2 points.
- Score 0 if the answer is "no" or "we don't know."
- Score 1 if it's partially true or you have an educated guess but not instrumented data.
- Score 2 if it's clearly true and you can pull the number in under five minutes.
- Maximum score: 50.
"We don't know" is a zero. That's deliberate. In a scaling readiness assessment, an unmeasured metric is functionally identical to a bad one — you can't defend spend against a number you can't produce.
Write your section subtotals down. The distribution matters more than the total, and the interpretation section explains why.
Section 1: Demand & Channel Repeatability (10 points)
This section tests whether you have a growth engine or a growth anecdote.
1. Can you name your single largest acquisition channel and state what percentage of new revenue it drives — from a dashboard, not memory? 0 = no idea · 1 = rough sense · 2 = exact, instrumented number
2. Has that channel produced consistent volume for at least three consecutive months without a founder personally intervening in each deal?
3. Do you have a second channel contributing at least 15% of new pipeline? (Single-channel dependency is the most common hidden fragility we find. It's fine at seed. It's dangerous at Series A.)
4. When you increased spend or effort in your top channel by 50%, did output scale roughly linearly? 0 = never tested · 1 = tested, sub-linear · 2 = tested, roughly linear or better
5. Do you know your win rate or conversion rate by lead source, and does it differ meaningfully between sources?
What a strong score looks like
8–10 means you have at least one channel with proven elasticity and you understand its economics well enough to press harder. Below 5 means your growth to date is likely explained by founder effort, a one-time distribution event, or early-adopter demand that doesn't generalize — none of which survive a scaling budget.
Section 2: Retention & Product Fundamentals (10 points)
Scaling a leaky product is the most expensive mistake in growth. You're paying full CAC to fill a bucket with a hole in it.
6. Do you have cohort-based retention curves (logo and revenue) going back at least six months?
7. Does your retention curve flatten — i.e., does it stop declining and hold at a stable plateau for some cohort? 0 = still declining to zero · 1 = flattens weakly · 2 = clear, durable plateau
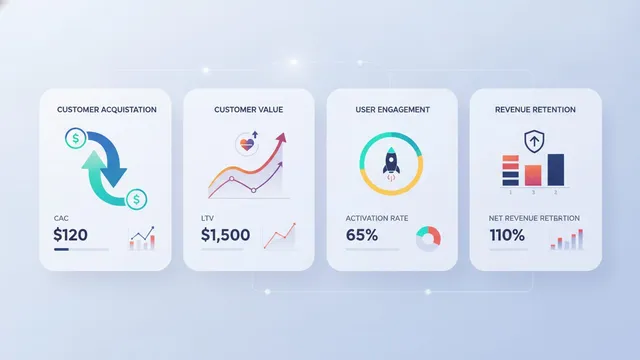
8. Do you know your net revenue retention (NRR), and is it above 100% for your core segment? (For SaaS benchmarks: median NRR for private B2B SaaS companies has hovered around 100–105%, with top quartile north of 115% — see SaaS Capital's annual retention benchmarks.)
9. Have you identified a measurable activation event that correlates with long-term retention, and do you track the percentage of new users who reach it?
10. Can you name your top two churn reasons with evidence (exit surveys, usage data, CS notes) rather than opinion?
What a strong score looks like
This is the section founders most often overestimate. A flattening retention curve is the closest thing to a hard prerequisite for scaling spend. If your retention curve still trends toward zero, more traffic just means more churn — and your CAC payback math is fiction. If you're evaluating product-led motions specifically, our PLG Readiness Quiz goes deeper on activation instrumentation and self-serve conversion mechanics.
Section 3: Unit Economics (10 points)
11. Do you know your blended CAC and your paid CAC as separate numbers?
12. Do you know your CAC payback period in months? (General benchmark: under 12 months is healthy for SMB-focused SaaS; under 18–24 months is acceptable for enterprise. Anything over 24 months and you're financing growth with equity, not cash flow.)
13. Is your LTV:CAC ratio above 3:1 for your primary segment, calculated with gross margin rather than revenue?
14. Do you know your gross margin at the unit level, including infrastructure, support, and payment processing costs?
15. Can you produce contribution margin by customer segment or channel?
What a strong score looks like
You cannot responsibly scale spend without a defensible payback number. If you scored below 6 here, the highest-ROI project available to you is not a growth campaign — it's building the analytics layer that produces these numbers reliably. Our LTV:CAC Ratio Calculator with Payback Period and Cohort Projections exists for exactly this gap, and the Growth Metrics Glossary covers definitional traps (like using revenue instead of gross profit in LTV) that quietly inflate half the ratios we see in board decks.
| Metric | Not ready to scale | Ready to scale | Scale aggressively |
|---|---|---|---|
| CAC payback | > 24 months | 12–18 months | < 12 months |
| LTV:CAC (gross-margin based) | < 2:1 | 3:1 | > 4:1 |
| Net revenue retention | < 90% | 100–110% | > 115% |
| Logo retention (annual, B2B) | < 70% | 80–90% | > 90% |
| Gross margin (SaaS) | < 55% | 65–75% | > 75% |
| Channel concentration | > 90% one channel | 60–75% top channel | < 60% top channel |
Section 4: Data & Measurement Infrastructure (10 points)
16. Is there one source of truth for revenue and funnel metrics that finance, sales, and marketing all reference without arguing?
17. Can you attribute pipeline to campaigns and channels with a methodology your team actually trusts?
18. Is your event tracking documented, with a tracking plan someone owns?
19. Can you segment any core metric by cohort, plan, channel, and geography without a two-week data request?
20. Do you review a consistent metrics dashboard on a fixed weekly or biweekly cadence with decisions attached?
What a strong score looks like
Measurement is the phase most teams skip, and it's why growth stalls at Series A. In our 4-Phase Growth Framework — Diagnostics → Measurement → Conversion → Scale — measurement sits second for a reason: every conversion and scale decision downstream is only as good as the instrumentation underneath it. You can read the full methodology on our process page.
The practical test: if your CEO asks "what's our CAC payback for self-serve customers acquired through paid social in Q3?" and the honest answer is "give me a week," you're not measurement-ready. And you will overspend, because you'll be optimizing on blended averages that hide both your best and worst segments.
Section 5: Execution Capacity & Team (10 points)
21. How many meaningful growth experiments did you ship in the last 30 days? 0 = 0–1 · 1 = 2–4 · 2 = 5+
22. When an experiment requires engineering work (new page, pricing test, onboarding change), can it ship within two weeks?
23. Is there a single named owner for each core growth metric?
24. Do you document experiment results — hypothesis, result, decision — somewhere searchable?
25. Does your team have senior-level capability across product, engineering, data, and marketing simultaneously — not just one or two of them?
What a strong score looks like
This is the section that separates companies with a plan from companies with an engine. Experiment velocity compounds: a team shipping five tests a month with a 20% win rate generates roughly a dozen wins a year. A team shipping one test a month generates two. Same win rate, wildly different outcomes.
The bottleneck is almost never ideas. In diagnostics, it's overwhelmingly engineering capacity — growth ideas queued behind a product roadmap that ships quarterly. If that's your situation, the Experiment Velocity Calculator is worth ten minutes: it back-solves how many tests you need to hit a stated growth target, which usually reveals a capacity gap of 3–5x.
Scoring: What Your Number Actually Means
Add your five subtotals.
0–15: Pre-Scale (Find the Engine First)
You're not ready, and pushing spend now will destroy capital. That's not a criticism — plenty of $500K–$2M ARR companies score here, because early revenue often comes from founder-led sales that don't require instrumentation.
What to do next: Pick one channel and one segment. Instrument them properly. Get a retention curve you can see. Do not hire a growth team yet — hire or borrow the ability to measure. The single highest-leverage move is a diagnostic that identifies which of the five sections is actually blocking you, because founders in this band usually guess wrong about which one it is.
16–28: Emerging (Fix the Weakest Section)
You have signal but not a system. Typically: one channel works, retention is decent-but-unproven, and unit economics exist as a spreadsheet estimate rather than an instrumented reality.
What to do next: Look at your lowest section score, not your total. Emerging-band companies fail by scaling their strongest muscle while ignoring the weak one. If Section 2 (retention) is your low score, every dollar into acquisition is discounted by your leak rate. If Section 4 (measurement) is low, fix it first — it's the cheapest and it unblocks everything else. Target: get every section to 6+ before you increase spend materially.
29–40: Scale-Ready (Press Hard, Systematically)
You have a repeatable channel, retention that holds, economics you can defend, and enough instrumentation to steer. Your constraint is now execution capacity.
What to do next: Increase experiment velocity, expand into a second and third channel deliberately, and build the operating cadence that keeps quality high as volume rises. This is the band where an embedded pod produces the sharpest returns, because the diagnostic work is largely done and the leverage is in shipping. Companies in this band are the profile behind case studies like How a Series A SaaS 3x'd ARR in 9 Months with an Embedded Growth Pod.
41–50: Compounding (Protect the System)
You're operating a genuine growth system. Your risks shift: channel saturation, rising CAC as you exhaust the efficient audience, organizational drag as headcount grows, and metric drift as definitions fragment across teams.
What to do next: Diversify channels before your current one saturates, invest in defensibility (brand, SEO, community, product moats), and guard your operating rhythm. Most companies in this band lose momentum not from a bad decision but from a slow erosion of accountability. Our writing on high-performance teams and ownership covers that failure mode in detail.
The Three Readiness Traps We See Most Often
Trap 1: Confusing funding readiness with scaling readiness
A closed round means investors believe your story. It says nothing about whether your channels have elasticity. We've run diagnostics for companies six weeks post-Series-A with a scoring profile of a pre-seed company — because the round was raised on market size and team, not on an instrumented growth engine. The money creates pressure to spend before readiness exists.
Trap 2: Averaging away the truth
Blended metrics hide everything that matters. A blended CAC payback of 15 months might be one segment at 6 months and another at 40. Scaling the average means scaling the bad segment alongside the good one. Every section of this quiz asks for segmentation for that reason.
Trap 3: Hiring specialists into an unmeasured funnel
The instinct at Series A is to hire a paid specialist, then an SEO lead, then a lifecycle person. Each optimizes their slice. Nobody owns the connective tissue — the tracking plan, the shared definitions, the engineering work that makes tests shippable. This is precisely the gap that produced the embedded-pod model: one senior team spanning product, engineering, data, and marketing so the handoffs disappear. We wrote about the cost difference in Manual Growth Ops vs AI-Augmented Growth: The Real Numbers.
How Readiness Maps to Stage
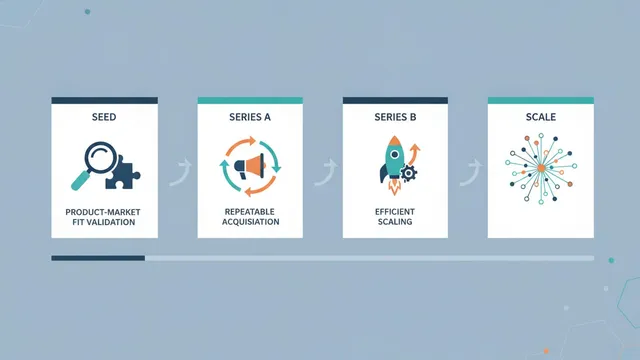
Readiness expectations should scale with stage. A seed company shouldn't score 45 — and a Series B company scoring 25 has a serious problem.
| Stage | Target quiz score | The one question that matters most | Primary failure mode |
|---|---|---|---|
| Seed | 15–25 | Does anyone retain? | Scaling before retention flattens |
| Series A | 26–35 | Is the channel repeatable without founders? | Hiring specialists into an unmeasured funnel |
| Series B | 33–43 | Can we add channel #2 and #3? | Single-channel saturation |
| Series C | 40–50 | Does the system survive headcount growth? | Organizational drag, metric drift |
If you want the stage-by-stage version of this in depth, The Startup Scaling Playbook: From Seed to Series B walks through each transition and the specific work that unlocks the next phase.
What to Do With Your Score This Week
Three concrete actions, in order:
- Share your section subtotals with your leadership team and see if they agree. Disagreement about your own scores is itself a finding — it usually means you lack shared definitions, which is a Section 4 problem masquerading as a strategy debate.
- Pick your lowest section and name one owner and one two-week deliverable. Not a quarter-long initiative. A two-week deliverable: a cohort retention dashboard, a documented tracking plan, a channel elasticity test with a defined spend increment.
- Pressure-test your conclusion with someone who has no stake in the answer. Internal teams are structurally biased toward "we're ready" — that's where the budget and headcount live.
We at Growaton run free growth diagnostic conversations for exactly step three: 45 minutes, your numbers, an outside read on which of the five sections is actually your constraint and what the two-week version of fixing it looks like. No deck required. If a pod engagement makes sense afterward, our plans and pricing models are public — but plenty of these calls end with "here's what to do yourself first," and that's a fine outcome.
Scaling is a decision you should be able to defend with five numbers. If you can't produce them yet, that's the work.